Coty Reports Double-Digit Growth in FY24, Outpacing Beauty Market

Strong Revenue Growth Across Prestige and Consumer Beauty in FY24
Solid Gross Margin Expansion Supported by Multi-Lever Strategy
FY25 Guidance In-line with Medium-Term Targets, Including Expected Sequential Growth Improvement in Q1 and 1H25
New York, NY — Coty reported its results for the full fiscal year 2024 and the fourth quarter, ended June 30, 2024. The Company delivered its fourth year of results ahead of or in-line with expectations, while consistently executing across its strategic growth pillars.
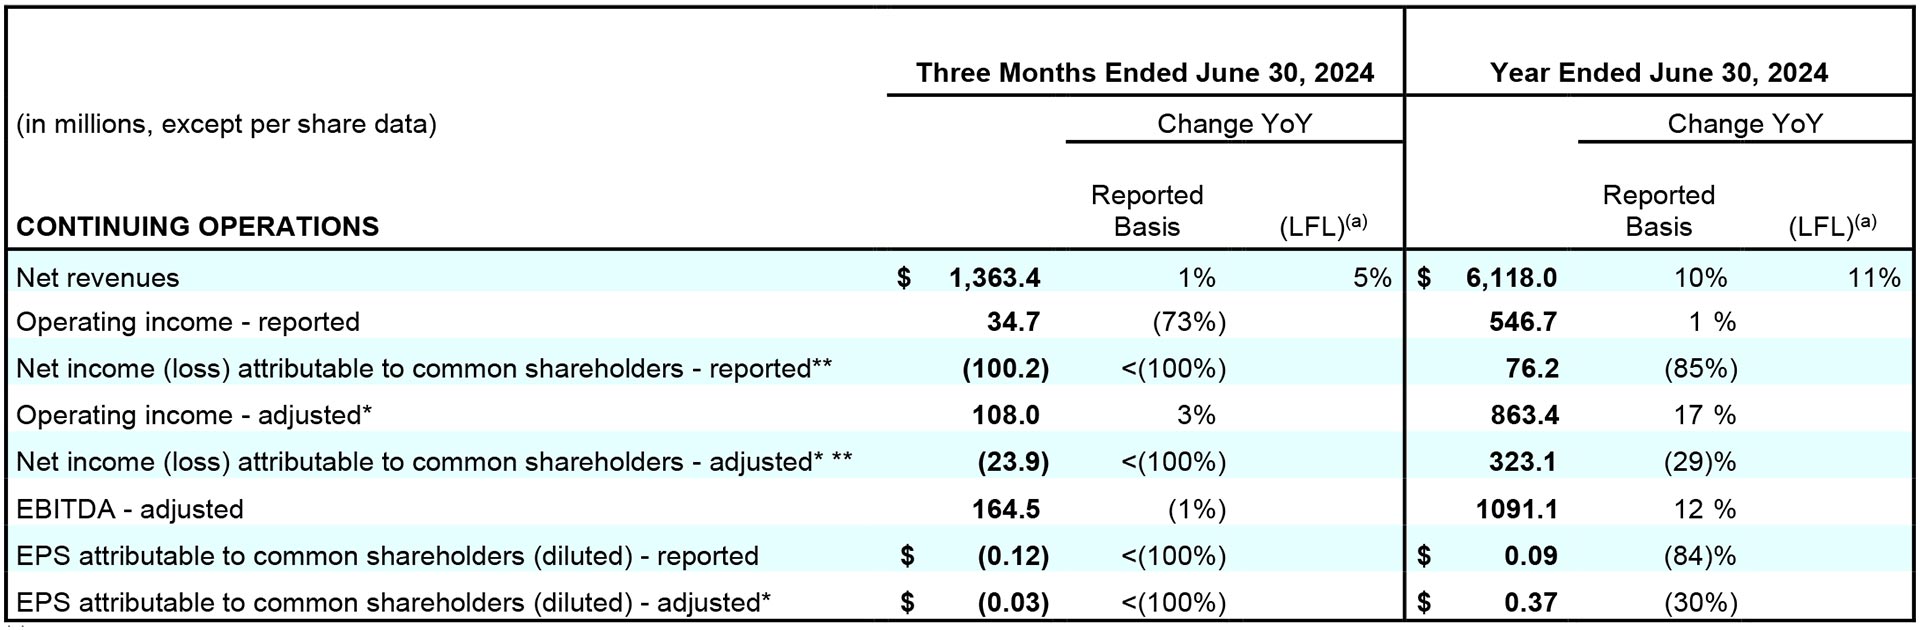
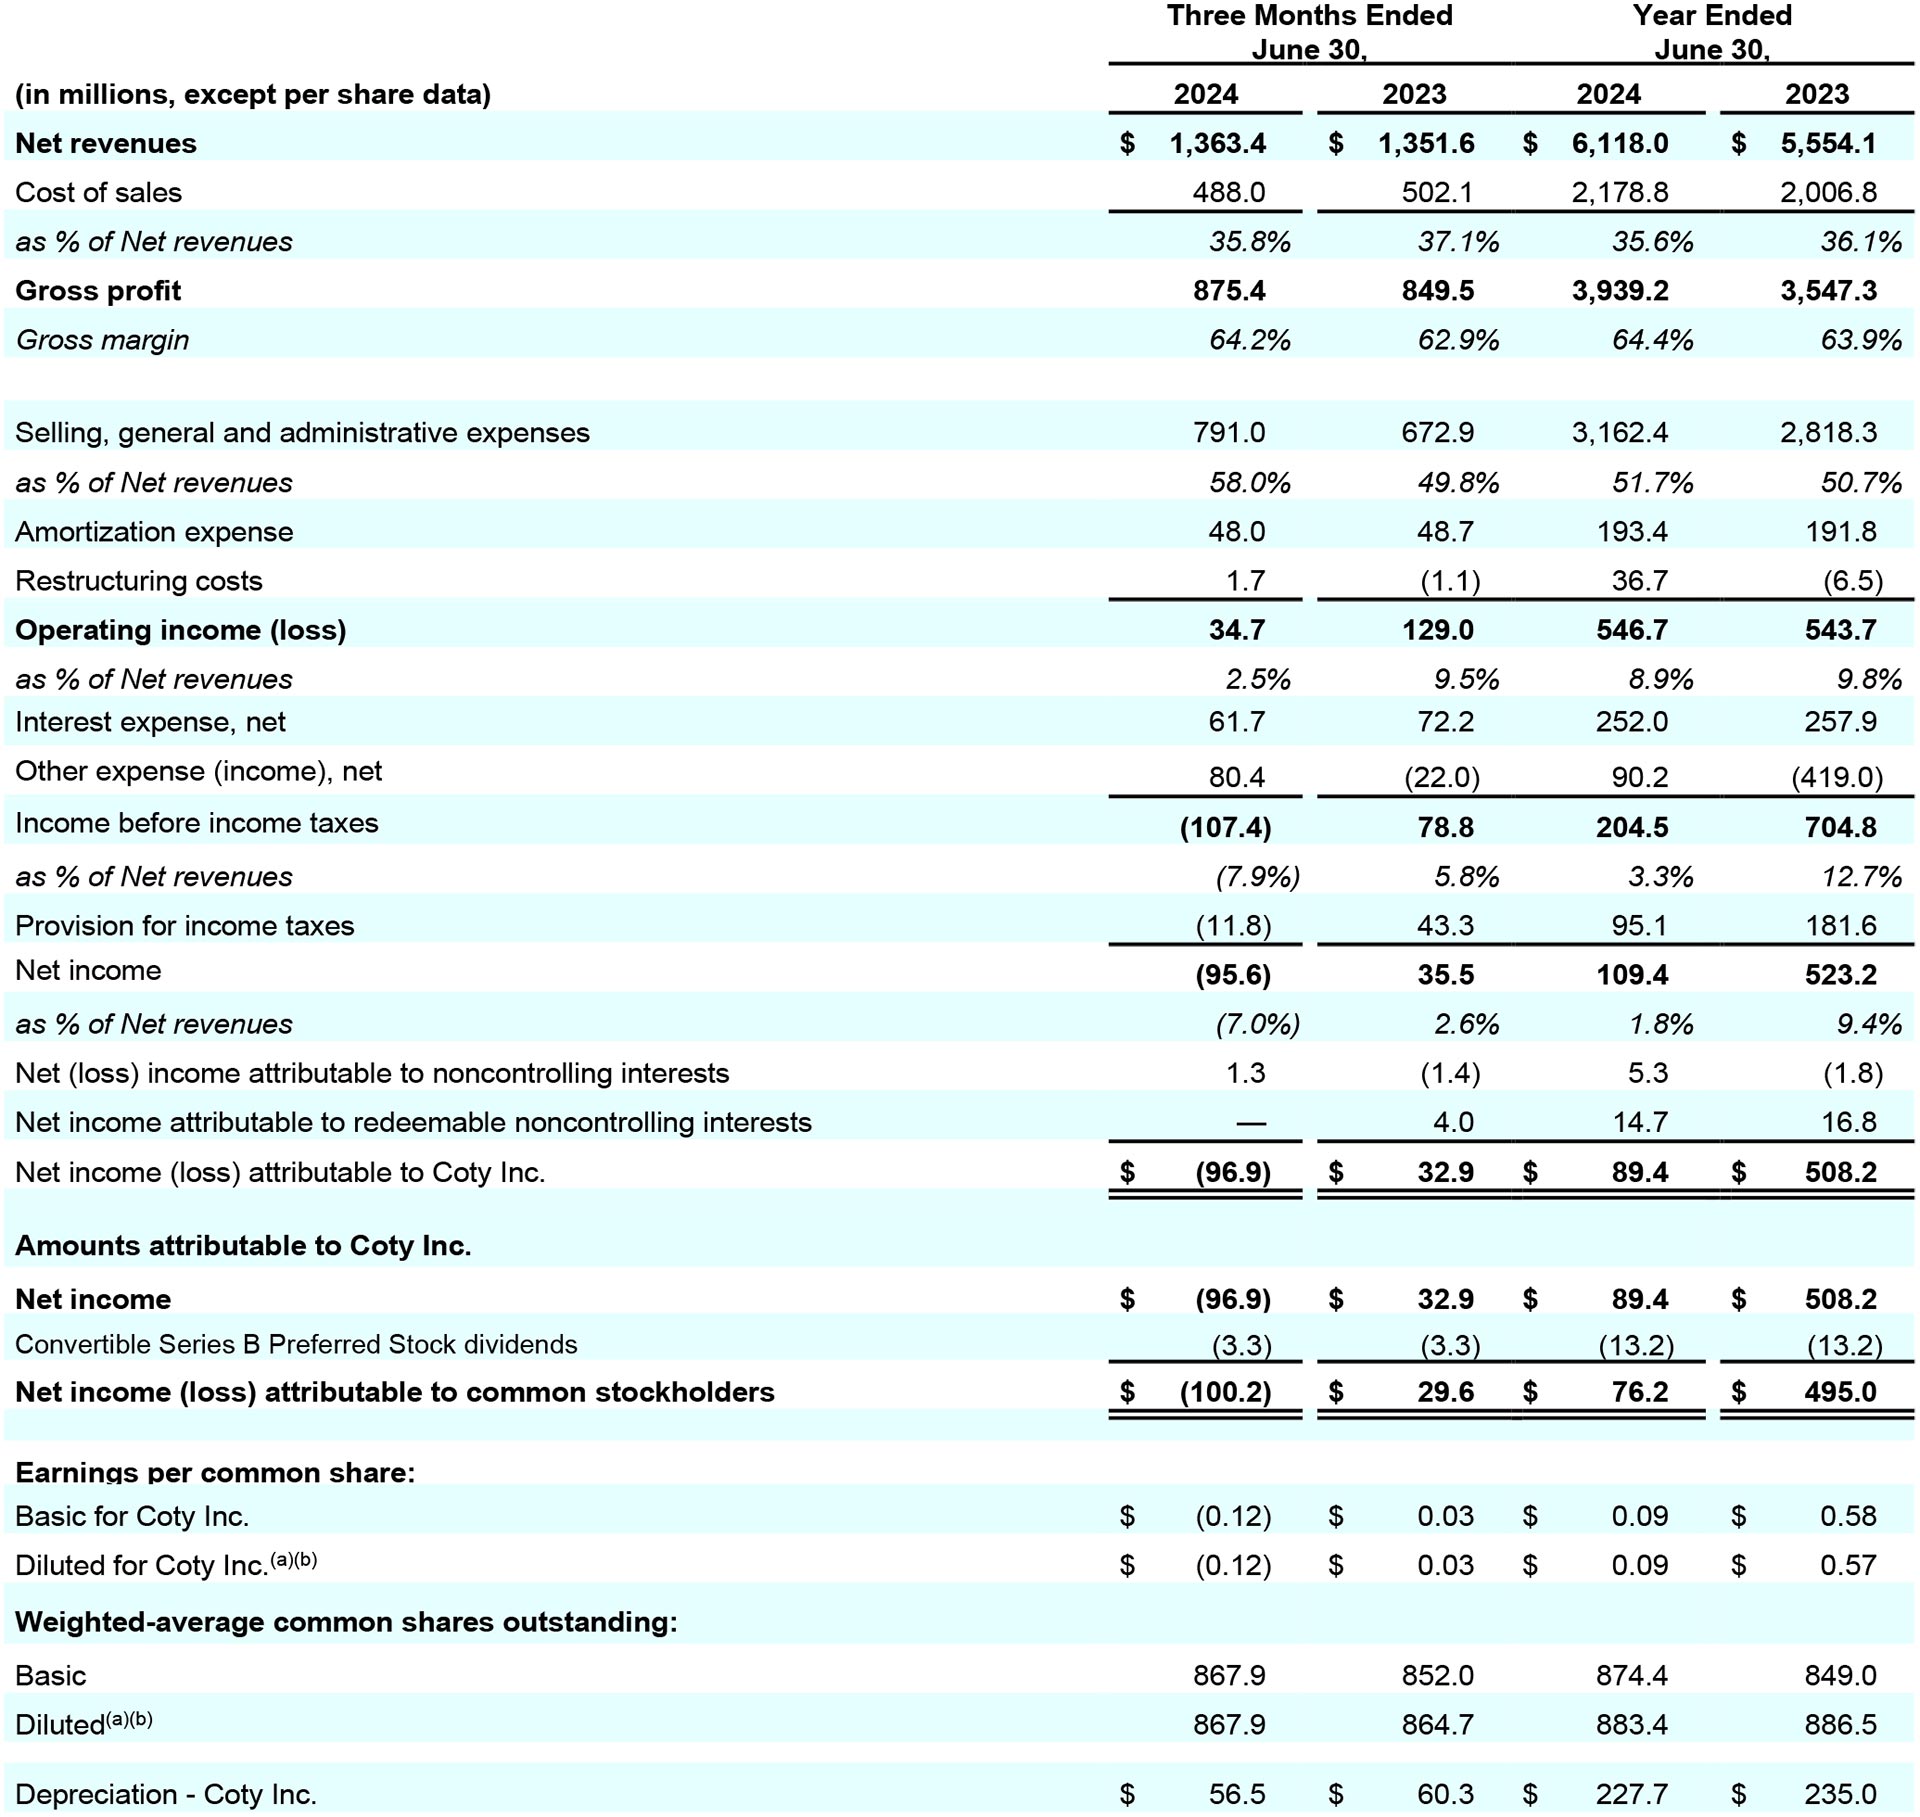
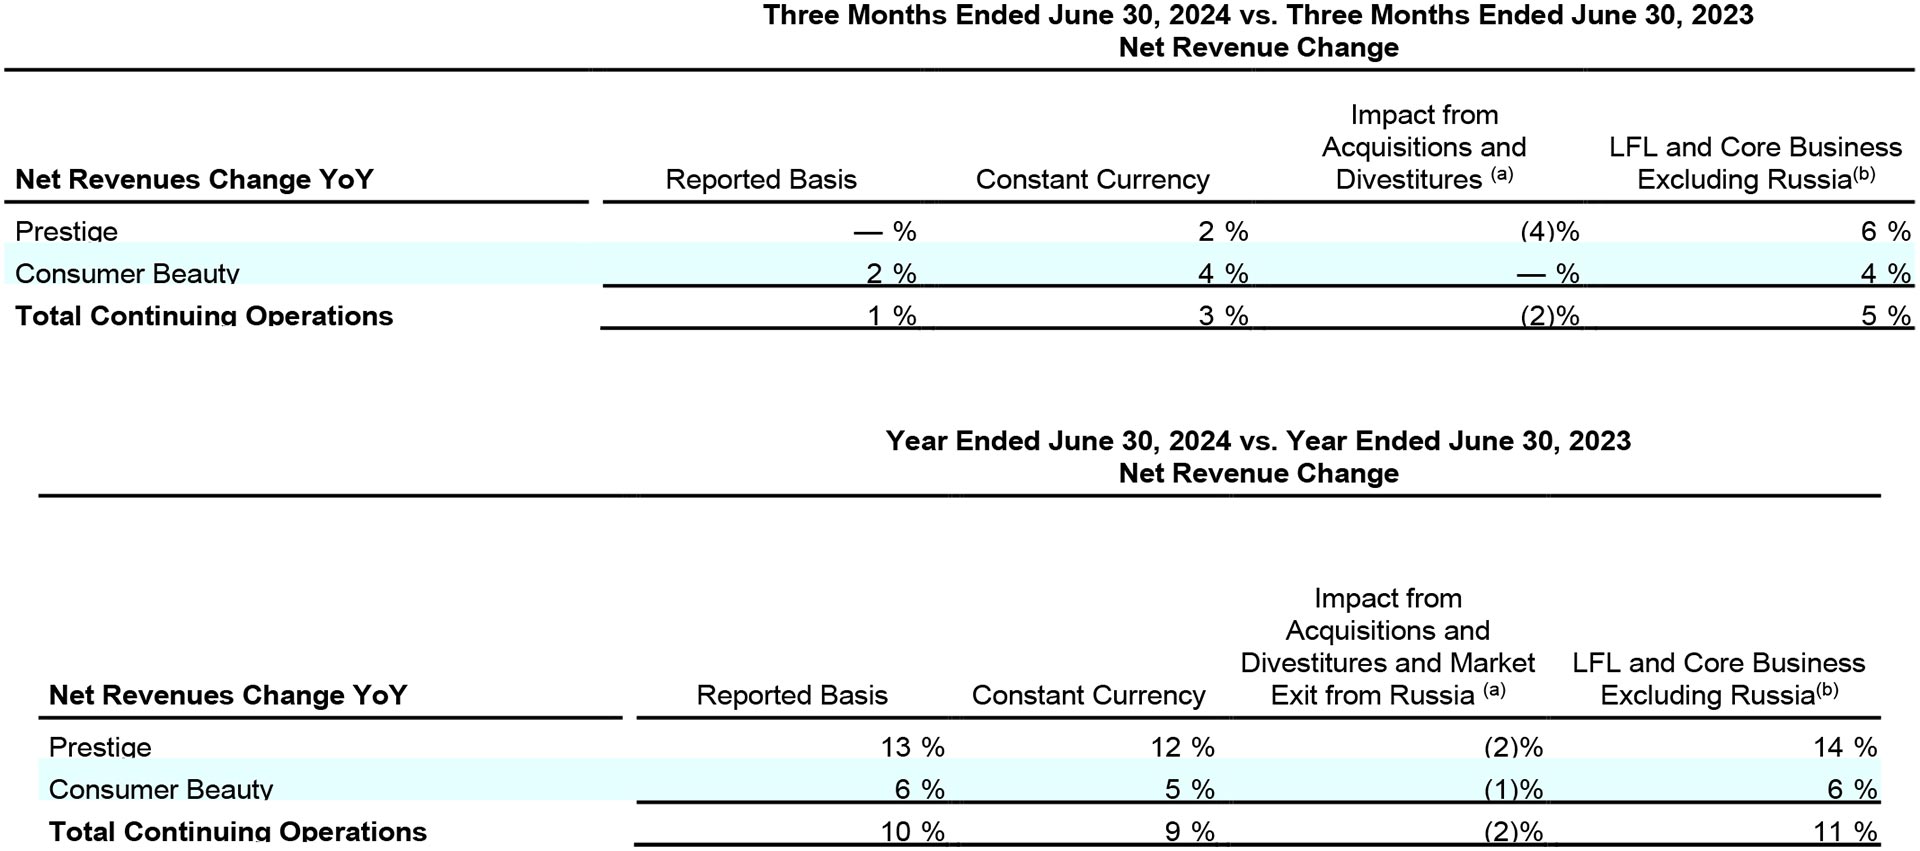
In FY24, total net revenues grew 10% on a reported and 11% on a LFL basis, at the upper end of Coty’s FY24 guidance range of +9% to +11% LFL, and ahead of the global beauty market which grew approximately 9%. The Company continued to deliver balanced reported net revenue growth, including growth in both Prestige and Consumer Beauty, across all regions and in each of its core categories. In FY24, Coty delivered a healthy reported growth mix with a low-single-digit percentage volume growth and a low double-digit percentage contribution from a combination of price, mix & other. In the second half of FY24, which largely balances out the elevated comparisons in the fourth quarter, net revenues grew 4% on a reported basis and 8% on a LFL basis, with reported results supported by growth across all core categories and regions. In 4Q24, Coty’s net revenues grew 1% on a reported basis and 5% on a LFL basis, which includes several percentage points of impact from lapping an elevated comparison base in the prior year as retailers restocked following supply chain shortages. The Q4 reported sales growth was supported by growth in both prestige and mass fragrances, prestige cosmetics and mass skin & body care, partially offset by a 2% FX headwind and a 2% negative impact from the divestiture of the Lacoste license. These results were at the upper end of the Company’s guidance for Q4 of low-to-mid single-digits percentage growth on a LFL basis. LFL revenue growth on company-wide basis and in the Americas region includes a contribution of 1% and 2%, respectively, from Argentina, which experienced hyperinflation.
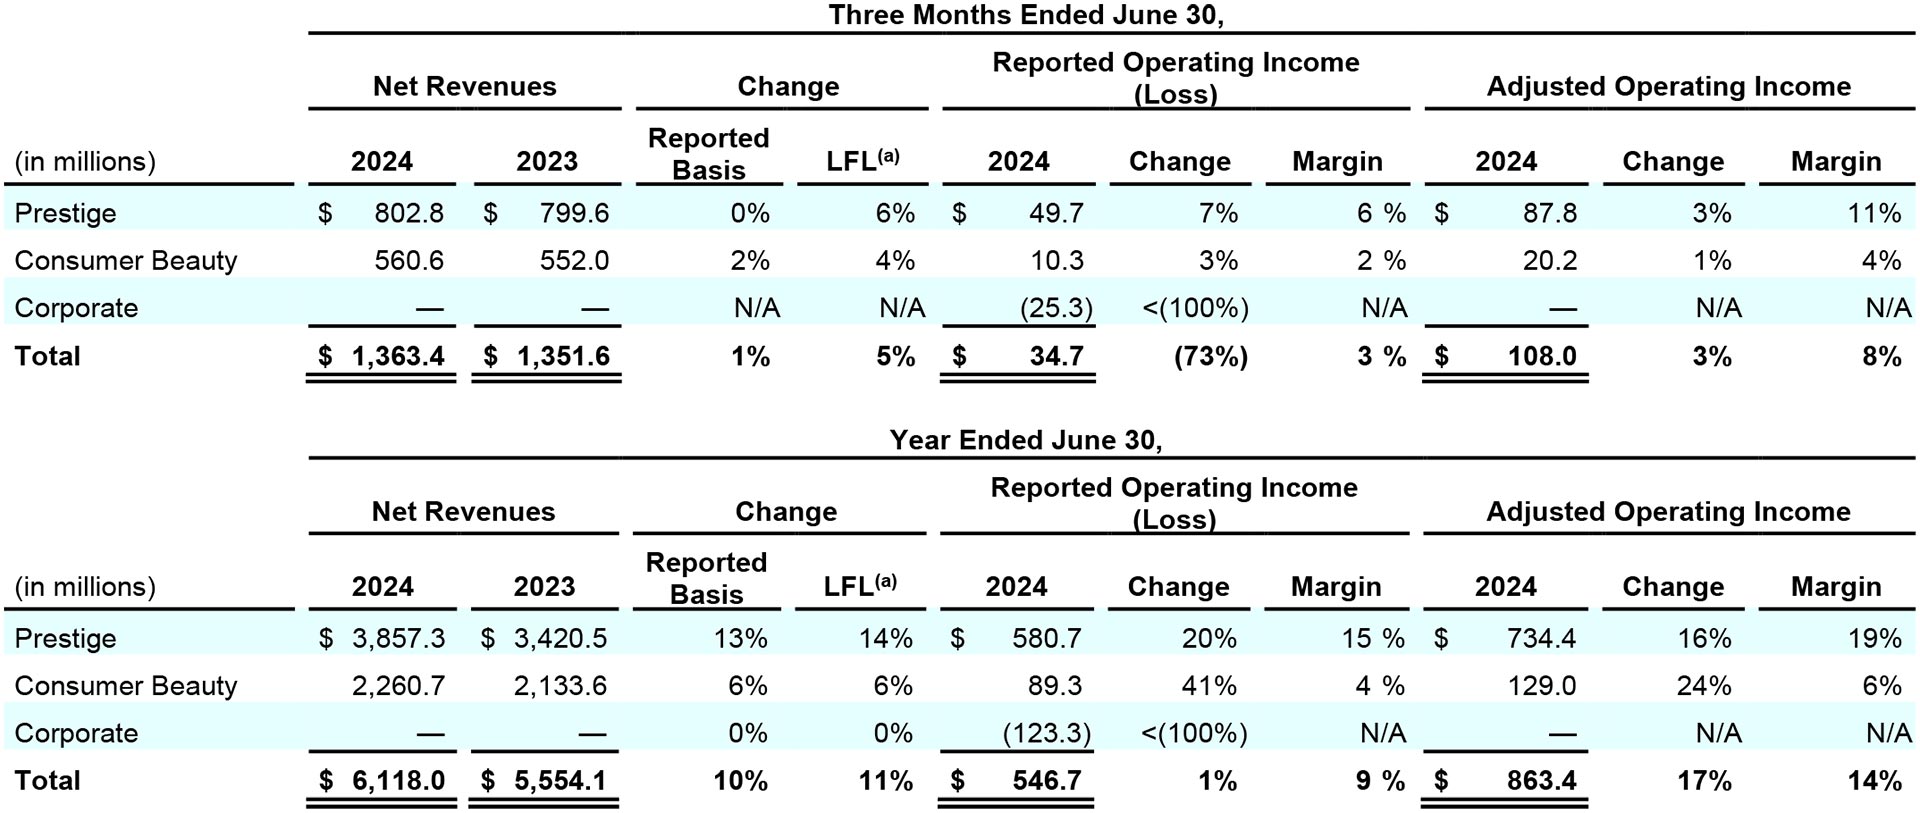
In FY24, Prestige net revenues grew a strong 13% on a reported and 14% on a LFL basis. In FY24, reported net revenue growth in Prestige was fueled by growth in fragrances, cosmetics and skincare. In the second half of FY24, which largely balances out the elevated prior year comparisons in Q4, Prestige net revenues grew 4% on a reported basis and 9% on a LFL basis. This second half Prestige reported growth was fueled by growth across fragrances, cosmetics and skincare partially offset by a headwind from the divestiture of the Lacoste license and a 1% headwind from FX. In 4Q24, Prestige net revenues were flattish on a reported basis and increased 6% on a LFL basis, which included a mid-single-digit headwind from elevated comparisons tied to retailer restocking in the prior year. Prestige reported net revenue growth in Q4 was driven by growth in fragrances and cosmetics and included a 4% negative impact from the divestiture of the Lacoste license and a 2% negative impact from FX.
In FY24, Consumer Beauty revenues increased 6% on both a reported basis and LFL basis, with growth in color cosmetics, mass fragrances and mass skin & body care. In the second half of FY24, Consumer Beauty net revenues increased 4% on a reported basis, supported by growth in color cosmetics, mass fragrances and mass skin & body care, and 5% on a LFL basis. In 4Q24, Consumer Beauty net revenues increased 2% on a reported basis and 4% on a LFL basis, driven by very strong double-digit growth in mass fragrance and mass skincare.
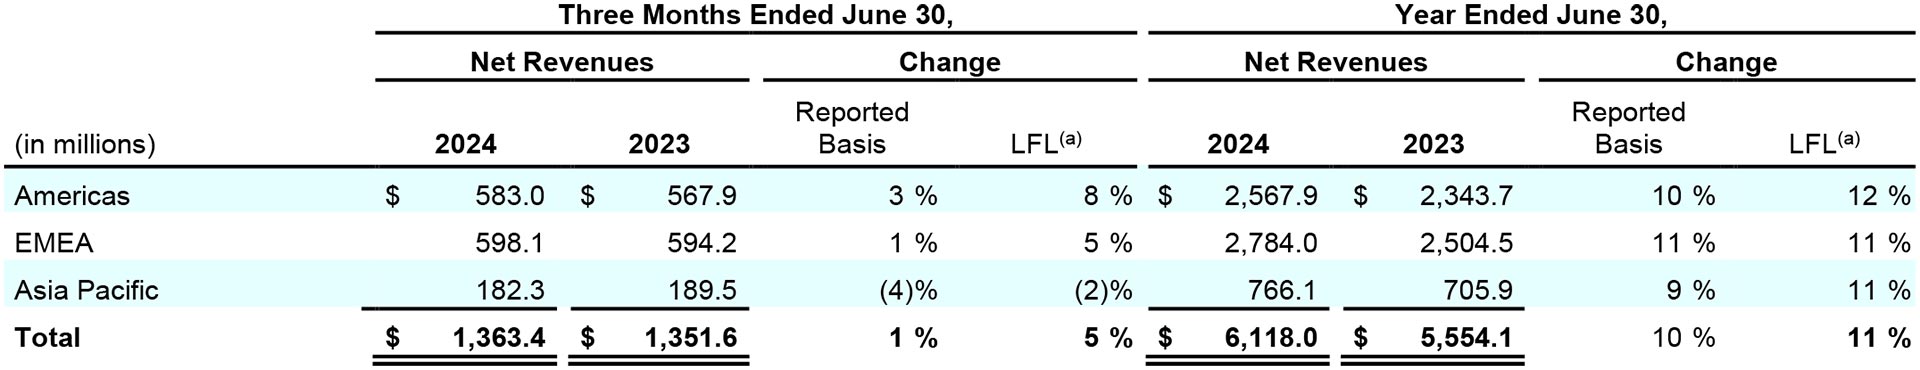
All regions generated high-single-digit to double-digit percentage reported net revenue growth in FY24. Americas net revenues rose 10% as reported and 12% LFL in FY24 and 3% as reported and 8% LFL in Q4. Americas reported net revenue growth in each of these periods was driven by strong high-single-digit to double-digit percentage growth in Latin America, Canada and the Travel Retail channel. EMEA’s net revenues increased 11% as reported and LFL in FY24 and 1% as reported and 5% LFL in Q4. Reported net revenue growth in EMEA in both periods was supported by growth across many European markets, African markets and the Travel Retail channel. Asia Pacific net revenues grew 9% as reported and 11% LFL in FY24, while in 4Q, net revenues declined 4% as reported and 2% LFL. Asia Pacific reported net revenue growth in FY24 was supported by double-digit percentage growth in Asia excluding China and the regional Travel Retail channel.
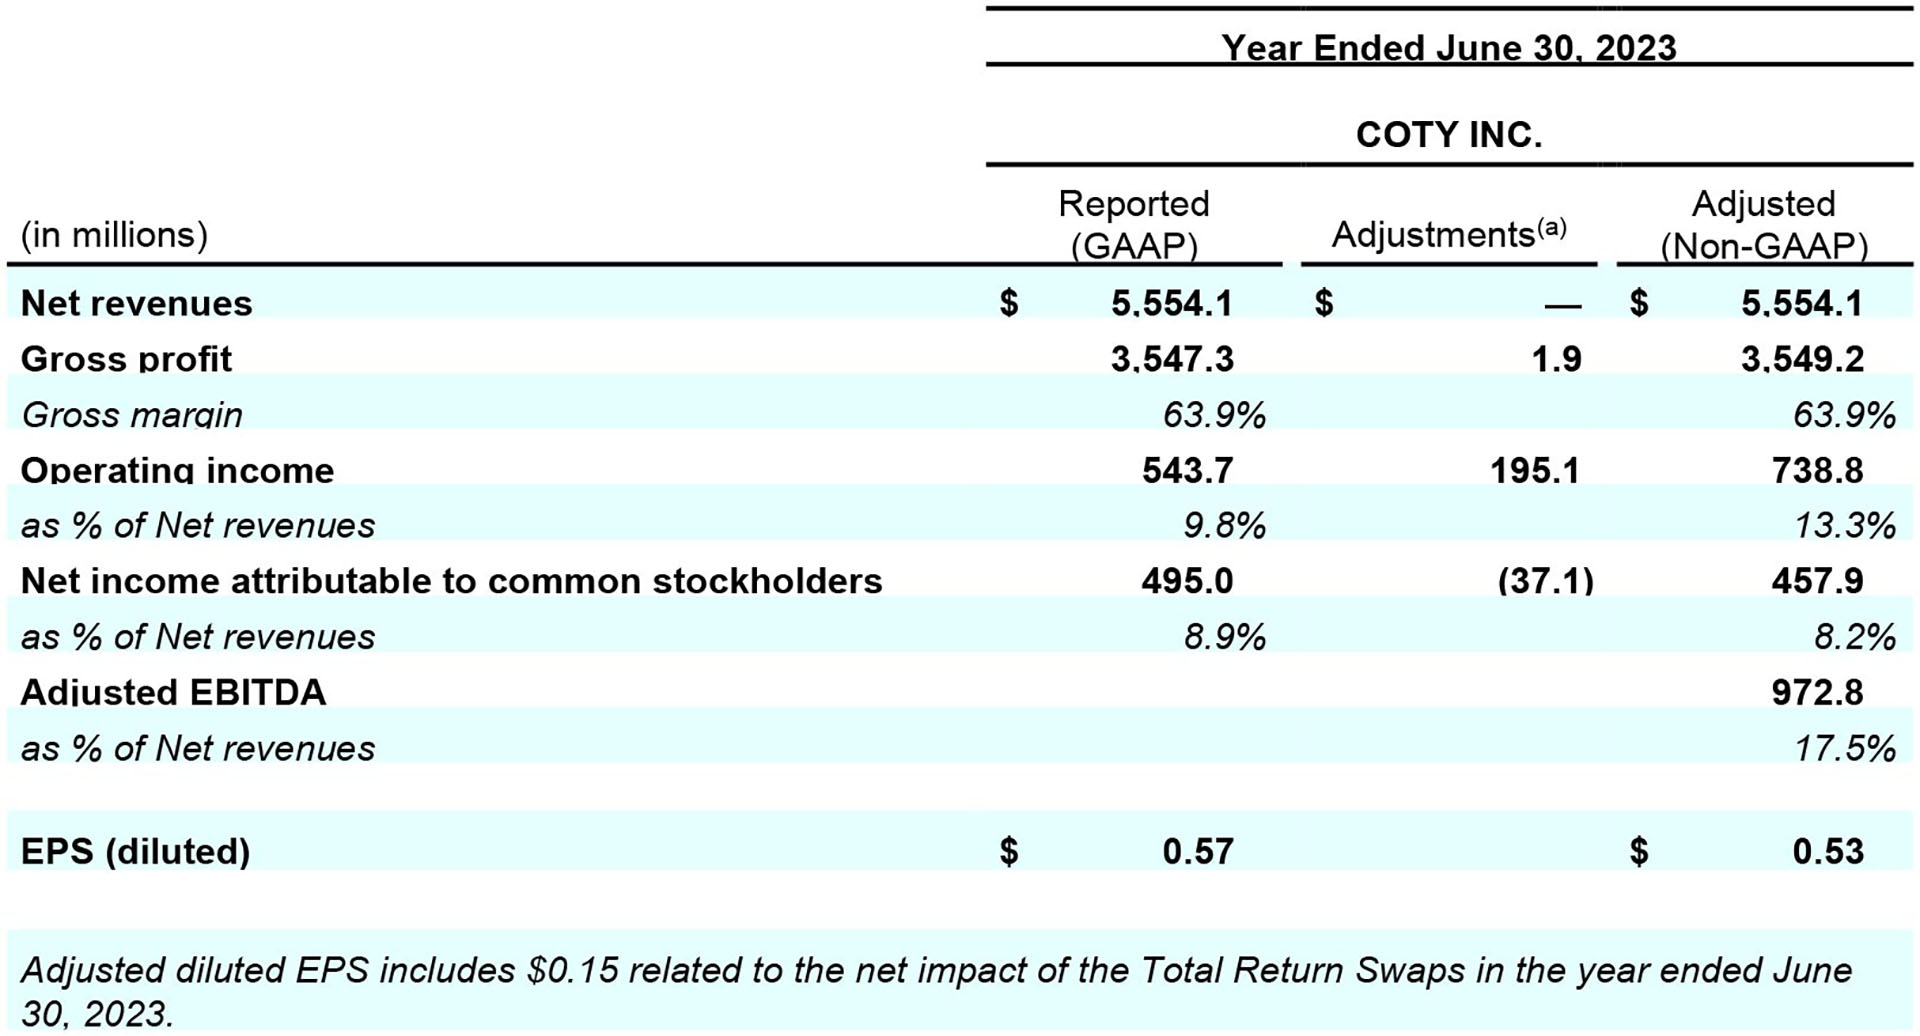
In FY24, reported and adjusted gross margin was 64.4%, with each up 50 basis points year-over-year. 4Q24 reported gross margin of 64.2% increased 130 basis points, while adjusted gross margin of 64.2% increased by 140 basis points year-over-year. Coty’s FY24 and Q4 reported gross margin improvement was fueled by supply chain savings and the benefit from pricing actions and premiumization, more than offsetting inflationary headwinds.
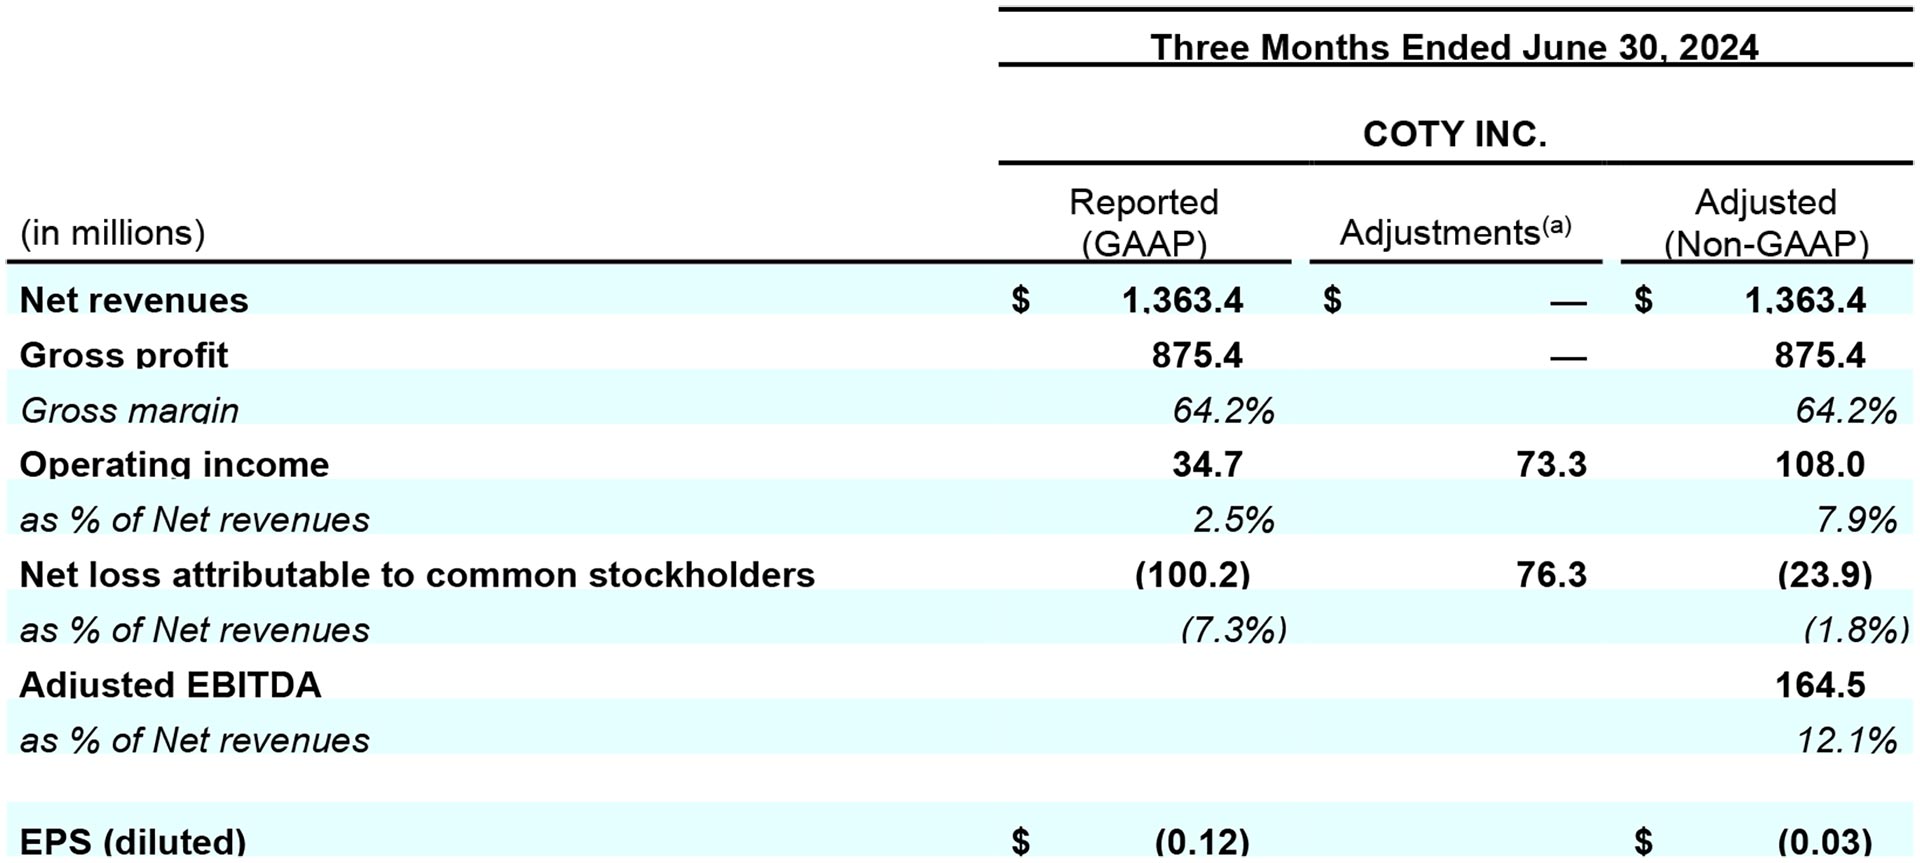
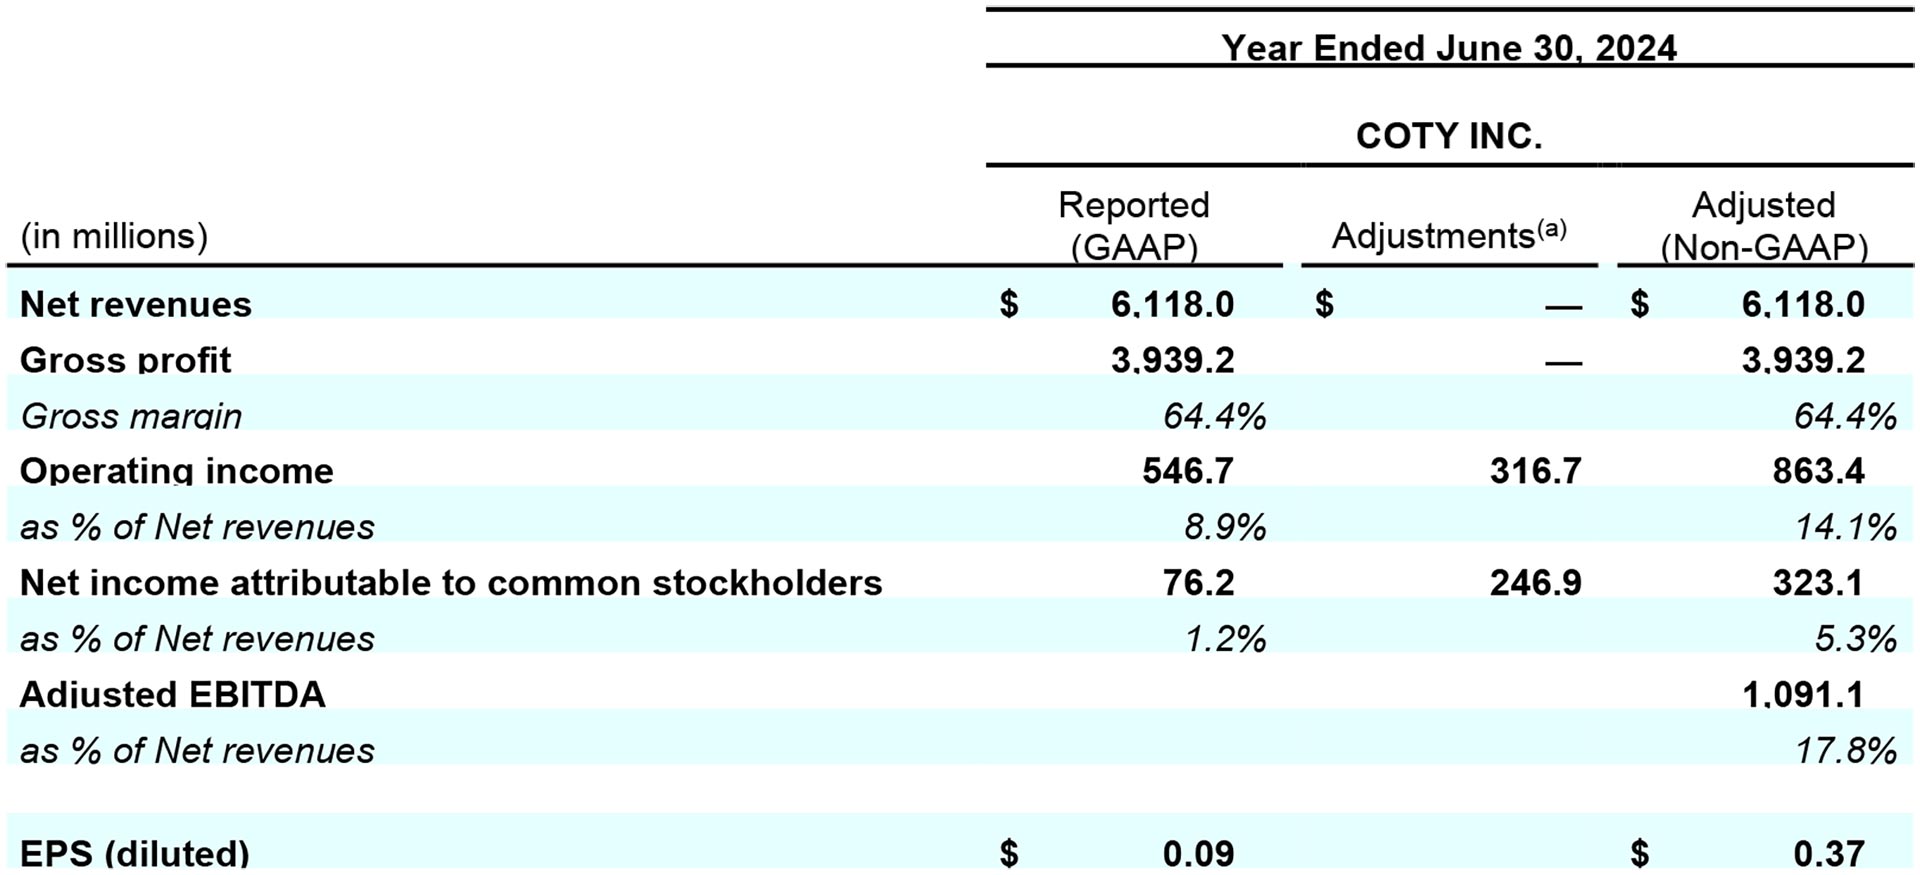
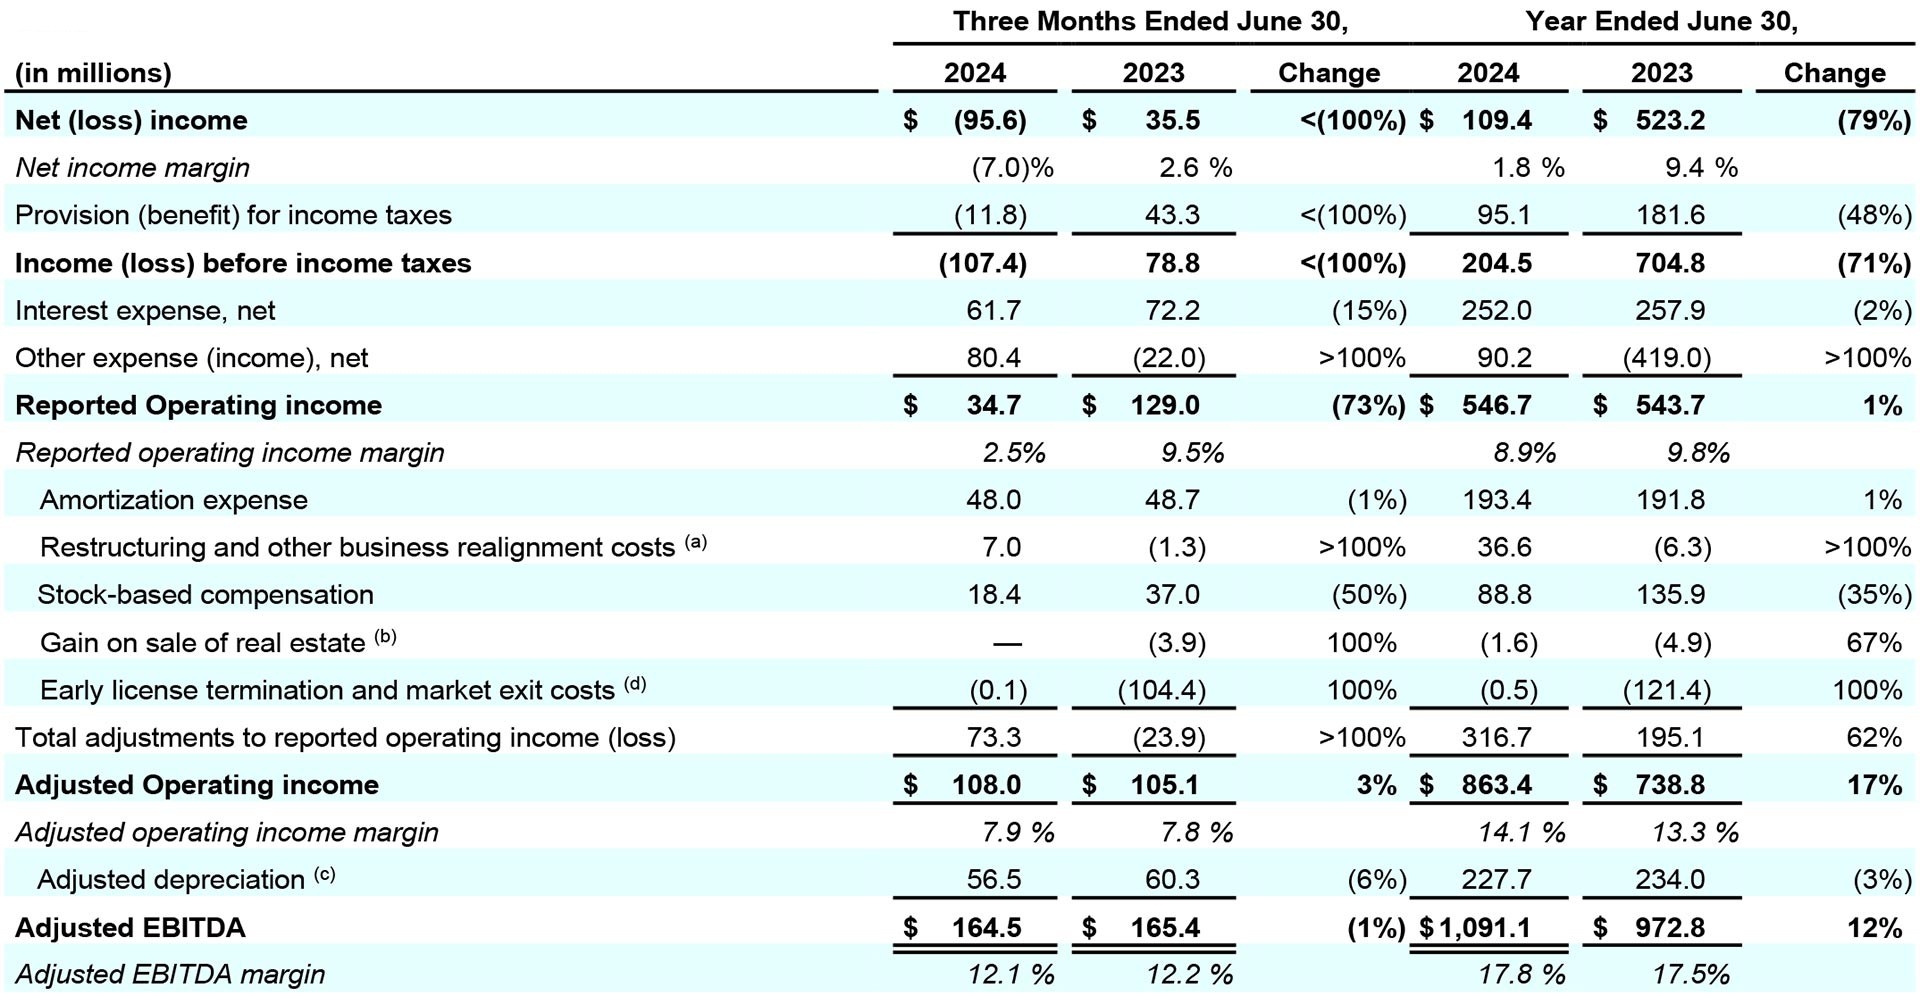
Coty generated reported operating income of $546.7 million in FY24, up 1% year-over-year, with a reported operating margin of 8.9%. Coty’s Q4 reported operating income of $34.7 million, with a reported operating margin of 2.5%, was down 73% year-over-year, reflecting the $104 million cash gain recognized in the prior year in connection with the divestiture of the Lacoste license. Coty’s FY24 adjusted operating income grew 17% to $863.4 million with an adjusted operating margin of 14.1%, reflecting strong margin expansion of 80 basis points, supported by the gross margin expansion and operating leverage on fixed costs. Q4 adjusted operating income of $108.0 million increased 3% year-over-year resulting in 10 basis points of adjusted operating margin expansion to 7.9%.
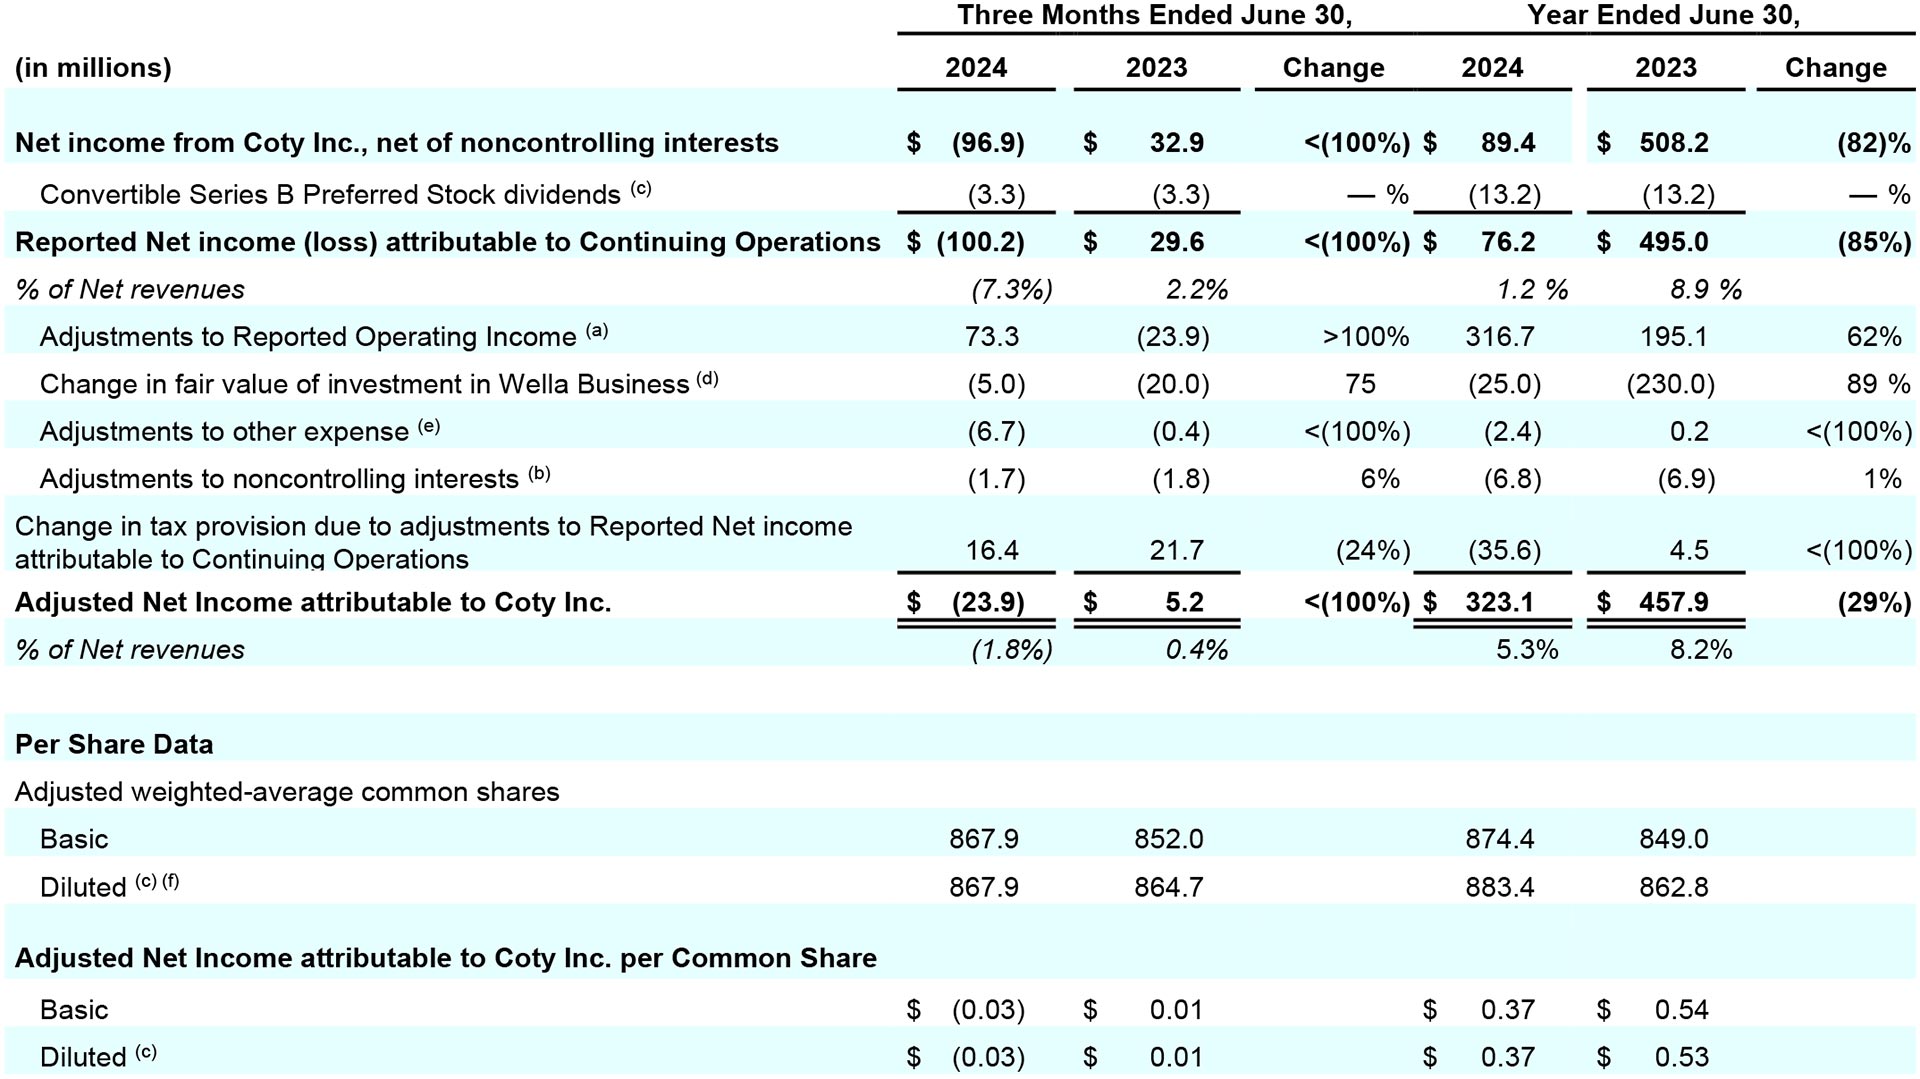
FY24 reported net income of $76.2 million decreased from $495.0 million in the prior year and reported net income margin was 1.2%, with the decline in the reported net income driven by over $300 million of gains recognized in the prior year related to the change in book value of the Wella stake and the divestiture of Lacoste. FY24 adjusted net income of $323.1 million decreased from $457.9 million in the prior year, and the adjusted net income margin was 5.3%. Q4 reported net loss of $100.2 million decreased from net income of $29.6 million in the prior year. In 4Q24, reported net loss margin of negative 7.3% decreased from 2.2% reported net income margin the prior year. The Q4 adjusted net loss of $23.9 million decreased from $5.2 million. The decline in reported and adjusted net income in FY24 and Q4 was fully driven by the negative impact of $103.8 million in FY24 and $87.8 million in Q4 from the mark-to-market on the equity swap due to the stock price decline in FY24 and Q4.
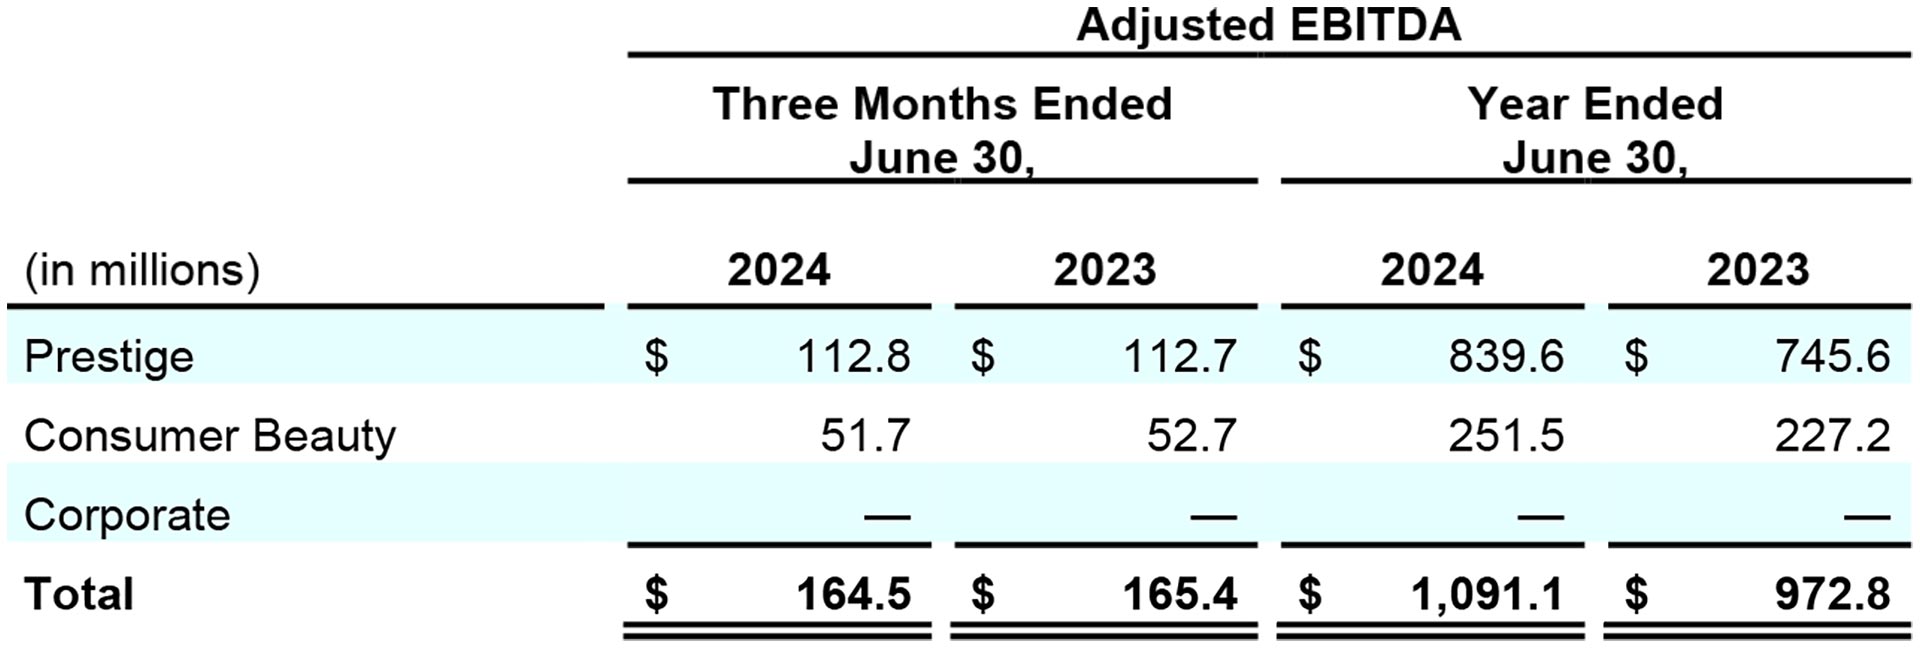
FY24 adjusted EBITDA grew 12% to $1,091.1 million, exceeding the Company’s adjusted EBITDA guidance of $1,080-$1,090 million. This drove a full fiscal year adjusted EBITDA margin of 17.8%, up 30 basis points year-over-year, at the high end of Coty’s guidance range.
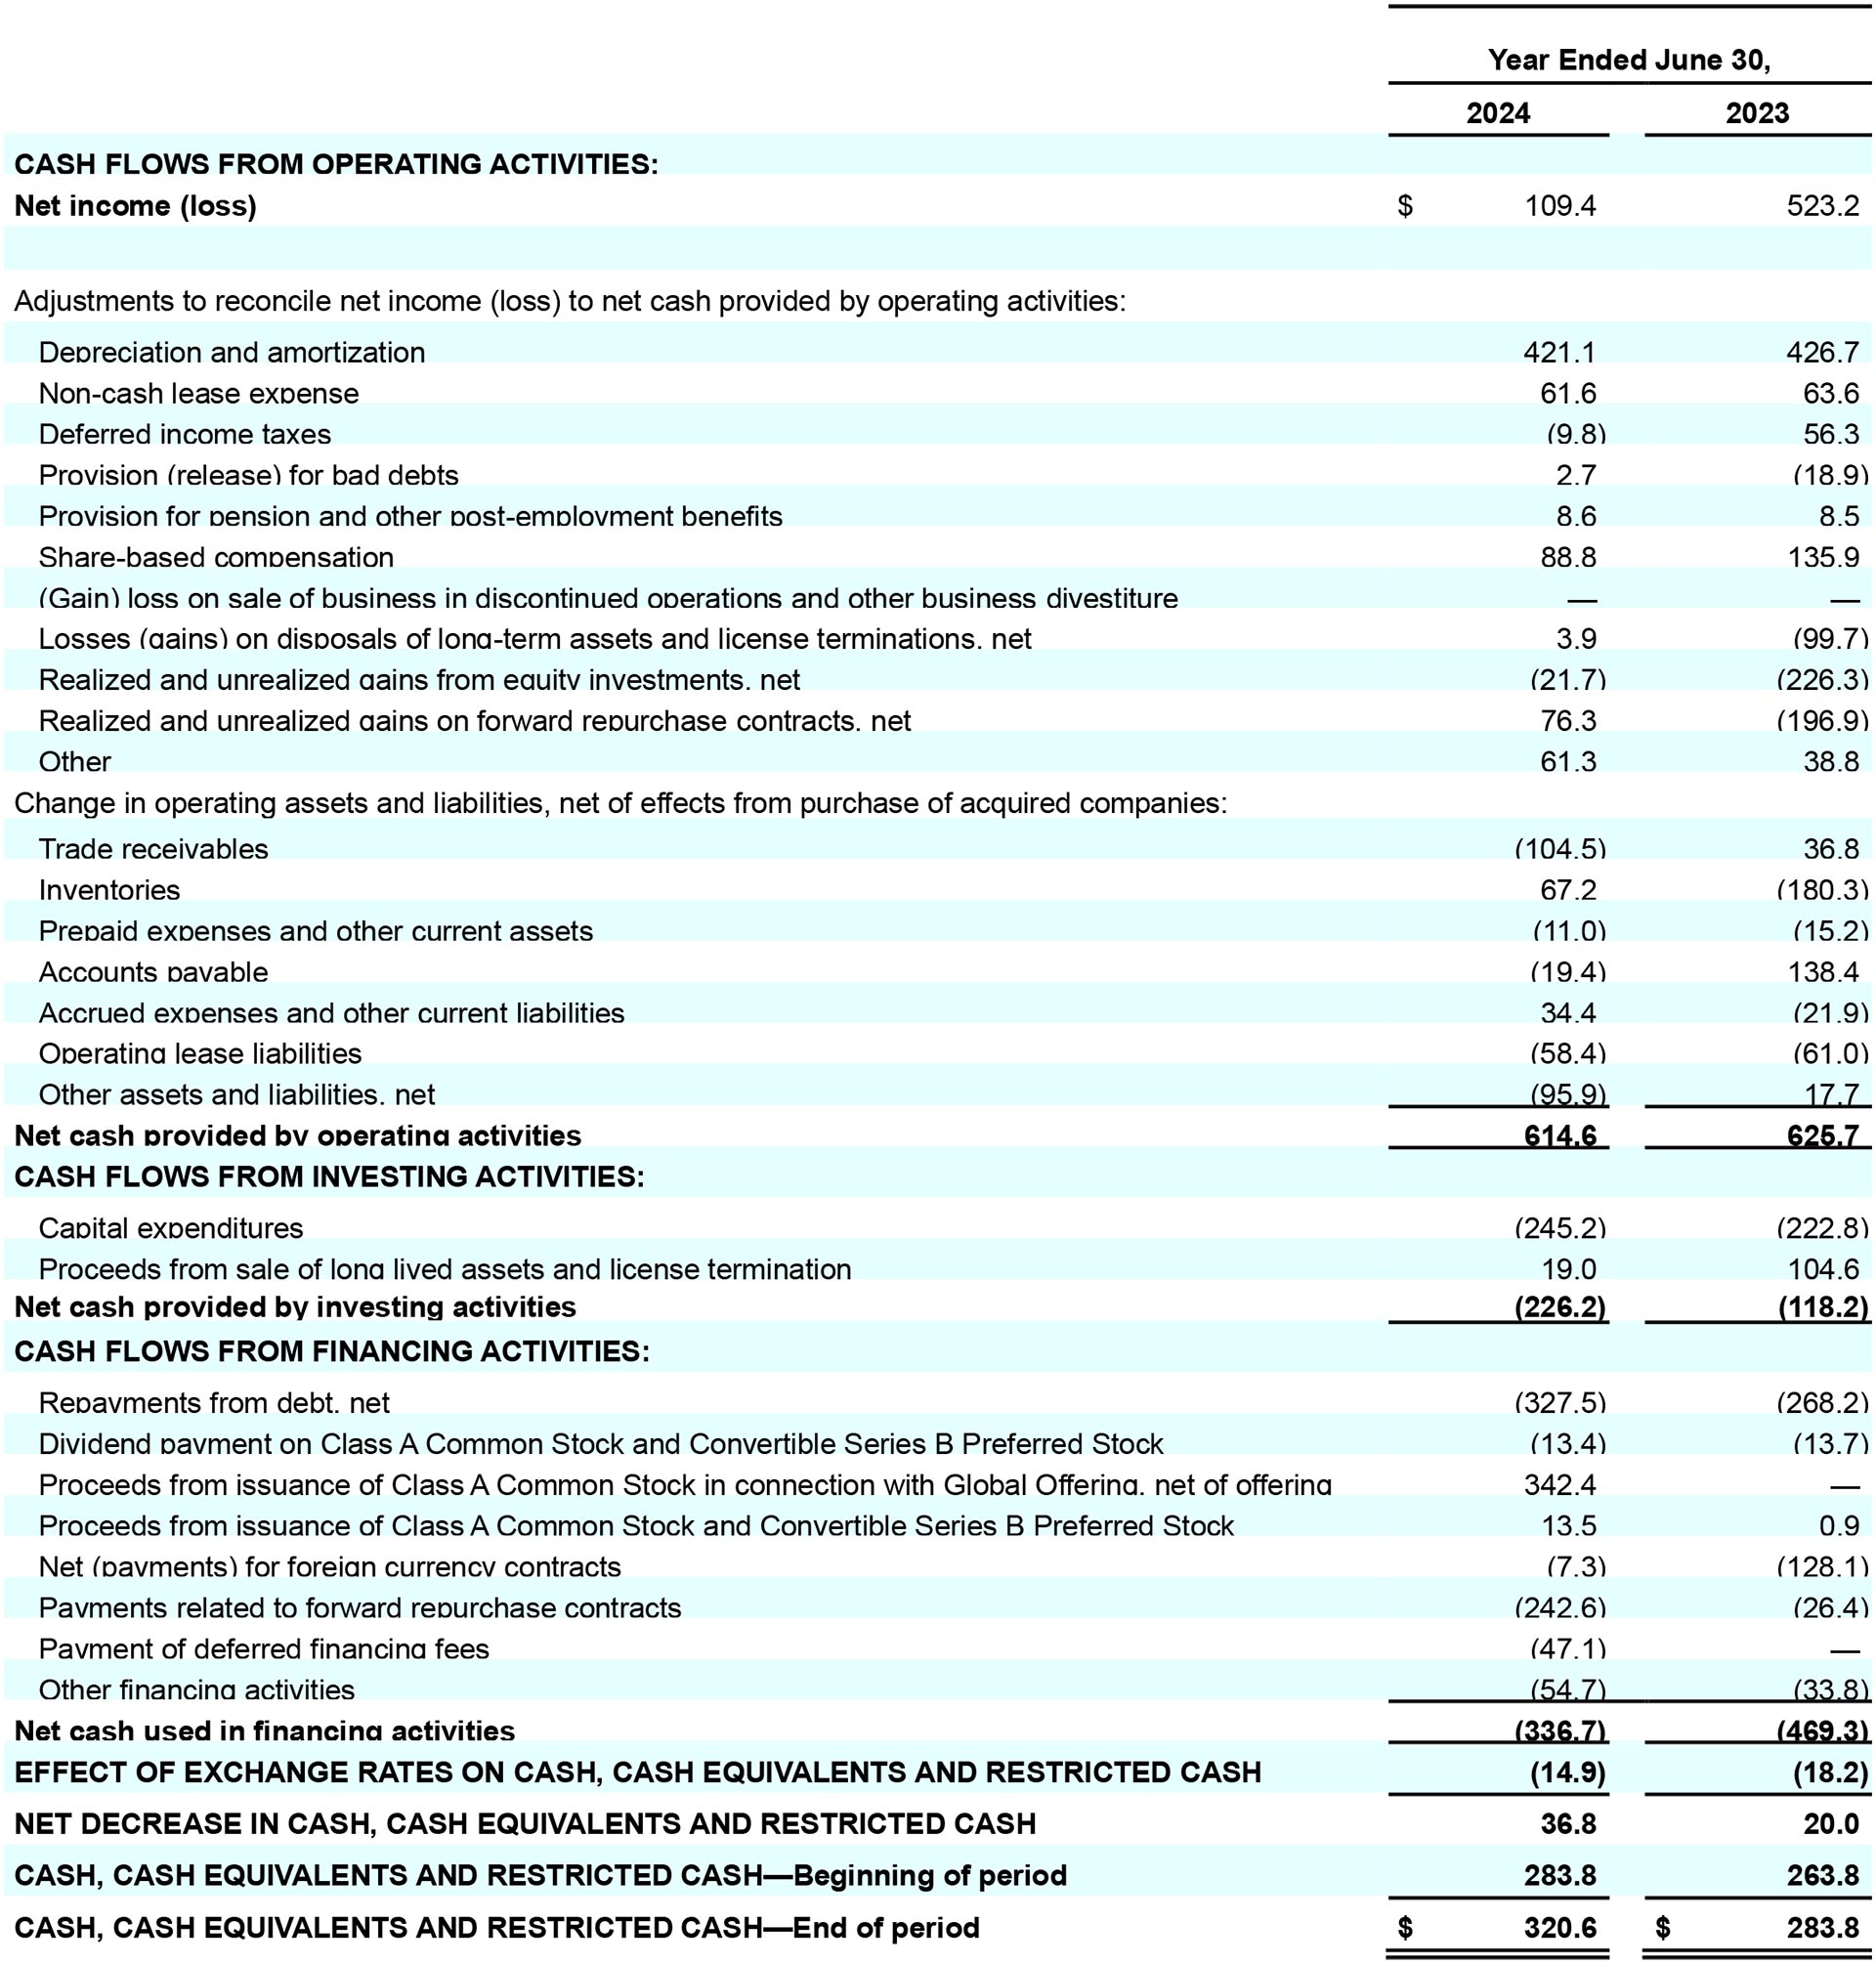
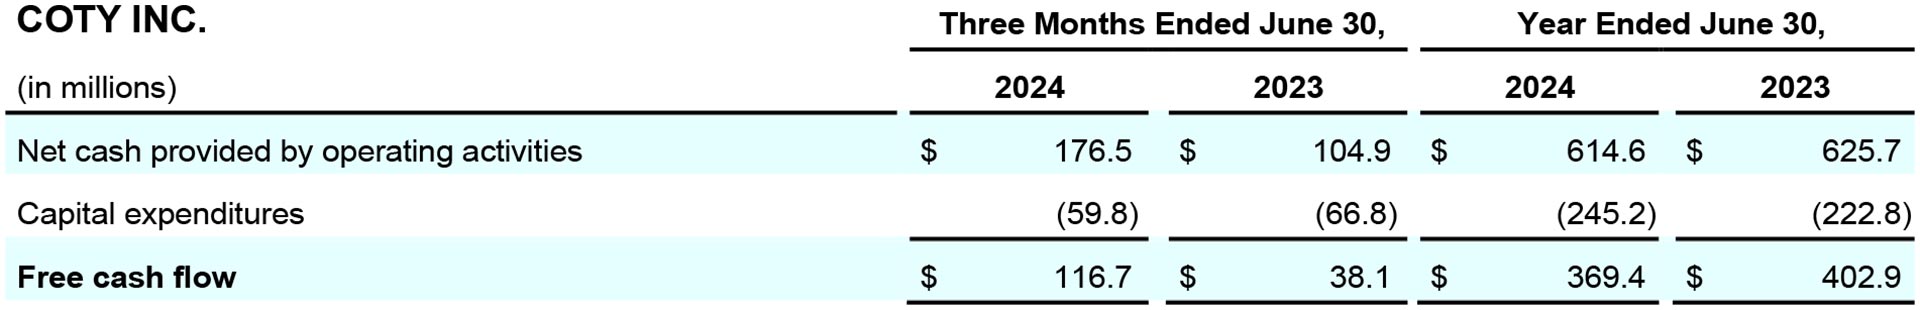
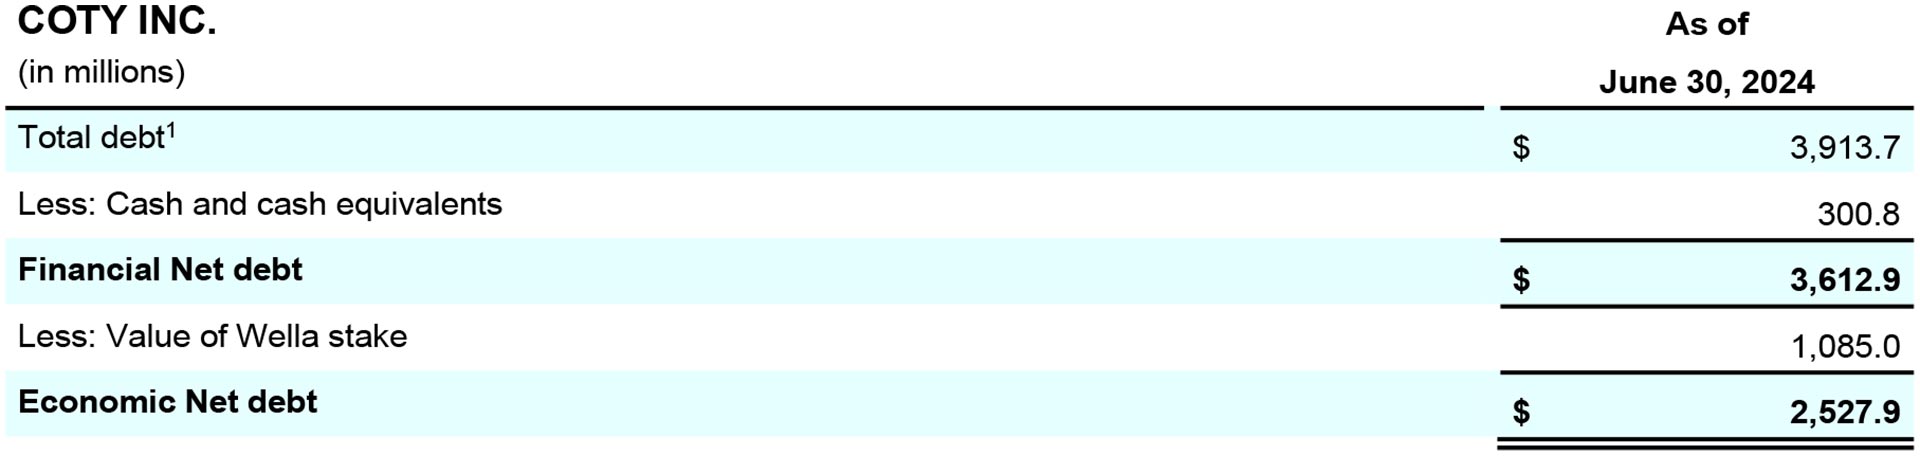
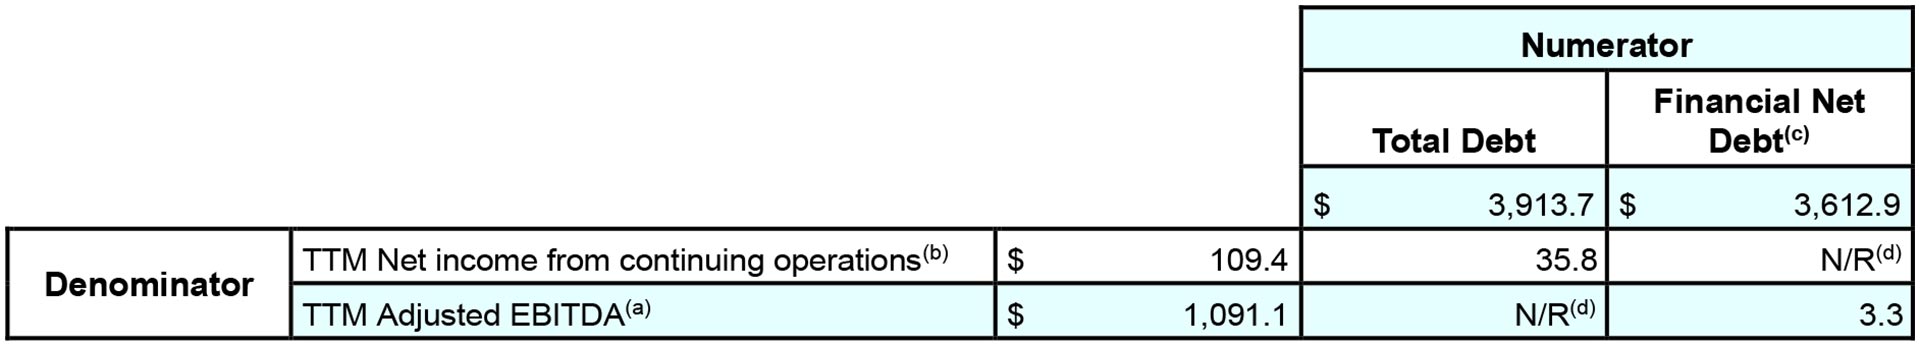
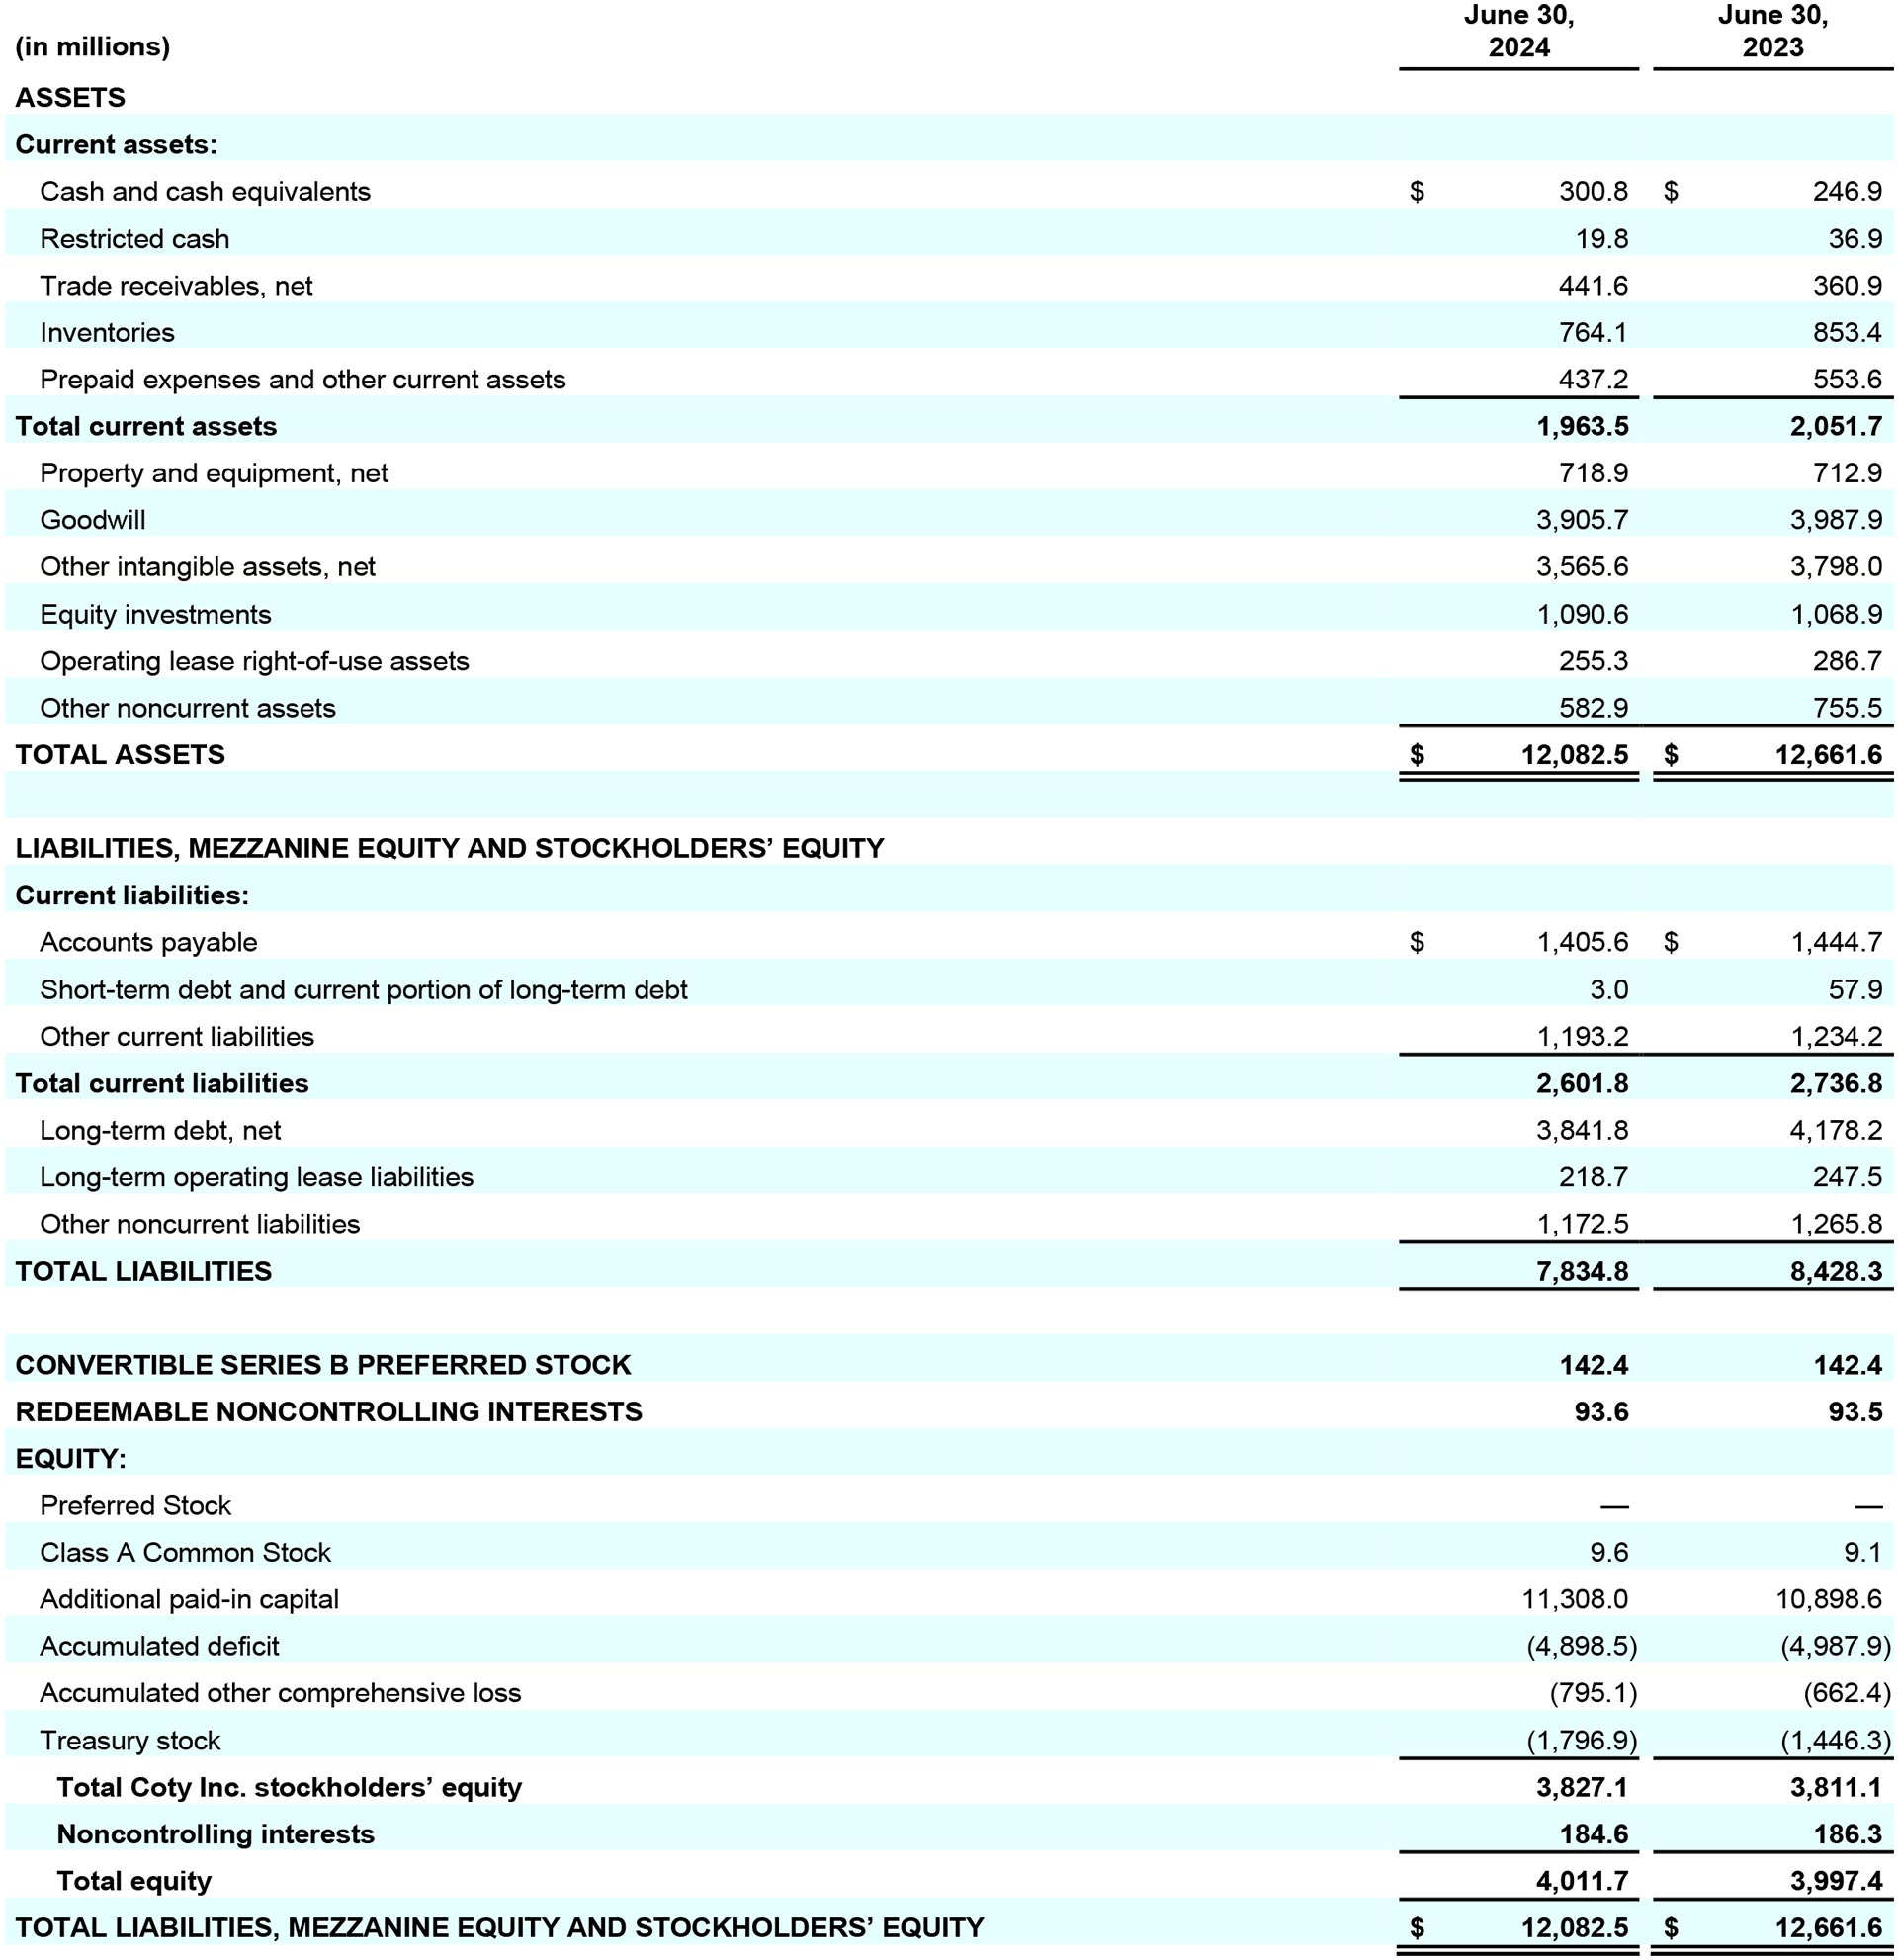
In FY24, cash flow from operating activities was $614.6 million and free cash flow was $369.4 million. In Q4, cash flow from operating activities was $176.5 million and free cash flow was $116.7 million. Total debt at the end of the fourth quarter totaled $3,913.7 million, while financial net debt totaled $3,612.9 million. This drove the total debt to net income ratio to 35.8x and the financial leverage ratio (net debt to adjusted EBITDA) to 3.3x. Coty’s retained 25.8% Wella stake was valued at $1,085.0 million at quarter-end, supporting economic net debt of $2,527.9 million.
Updates on Strategic Pillars
- The prestige fragrance market continued to grow approximately 10% in FY24 and in the recent quarter, remaining one of the fastest growing beauty categories across many markets, including the U.S. and China. In this favorable backdrop, Coty’s prestige fragrance revenues outperformed and grew by a mid teens percentage in FY24, fueled by the growth of existing icons and new innovations. In FY24, reported net revenue for all of Coty’s largest prestige fragrance brands grew by a mid-single-digit to double-digit percentage. Burberry Goddess, Coty’s biggest launch ever, continues to be a global success and is the number one female fragrance innovation in FY24 in the U.S. Canada and Germany, which coupled with strong growth in other Burberry franchises, drove over 50% expansion in Burberry’s total reported net revenues in FY24. Marc Jacobs Daisy Wild and Cosmic Kylie Jenner remain top ranked female innovations in the U.S. calendar year-to-date, reinforcing Coty’s position as a fragrance leader and trend-setter. Coty’s prestige cosmetics reported net revenues grew by a double-digit percentage in FY24, led by Kylie Cosmetics and Burberry. As Coty has continued to open new Kylie Cosmetics locations around the world, the brand is resonating globally, including in India, Singapore, Middle East and South Africa.
- Coty’s Consumer Beauty growth of 6% on a reported and LFL basis in FY24 was broadly inline with the mid-to-high single digit growth in the global mass cosmetics and mass beauty categories. In FY24 and Q4 on a LFL basis, Consumer Beauty grew across each of its core categories including cosmetics, mass fragrances, skincare and body care led by Brazil, with particular outperformance in mass fragrances which grew by a strong double-digit percentage on a reported basis. Consumer Beauty e-commerce sales grew approximately 30% in FY24, fueling a significant proportion of the division’s growth and further elevating the importance of channels not currently tracked by scanner data. As a result of solid execution in the Consumer Beauty business in FY24, the EBITDA margin for the segment expanded 50 basis points year-over-year to 11.1%. Coty continues to focus on its social media advocacy strategy as it propels viral Consumer Beauty innovations including CoverGirl Simply Ageless Skin Perfector Essence and Rimmel Thrill Seeker Extreme mascara, resulting in Rimmel gaining market share globally for the last 6 months and CoverGirl outperforming the U.S. omnichannel market in the past quarter.
- Coty’s skincare business, which contributed a mid-single-digit percentage of sales, generated strong sales growth in FY24. In FY24, Lancaster delivered double-digit percentage revenue growth, with improving momentum in Europe and more than doubling its sell-out in China, supported by its unique positioning as the photo-aging prevention and repair expert. In FY24, Philosophy returned to growth, with strong momentum in its core skincare franchises and a surge in its social media advocacy rankings. Orveda, with breakthrough innovation like the heavily awarded Omnipotent Serum, continued to drive strong productivity growth in its existing doors and DTC, paving the way for additional distribution targeted for FY25.
- Coty e-commerce channel reported net revenues grew by over 20% in FY24 and by a double-digit percentage in Q4. As a result, FY24 e-commerce penetration increased approximately 170 basis points year-over-year to nearly 20%. In Prestige, double-digit percentage e-commerce channel growth in FY24 was driven by Coty’s recent innovations, strong social media activations and collaboration with e-retail partners. In Consumer Beauty, e-commerce reported net revenue growth of over 30% in both FY24 and Q4 was supported by successful activations and growth in nearly all regions led by the U.S., LATAM and Europe. Coty gained e-commerce market share in both segments.
- The Company maintained momentum in growth engine markets and high growth channels. Coty’s global Travel Retail, which accounts for 9% of the Company’s sales, generated robust trends in all three regions, fueling reported net revenue growth of roughly 20% in FY24. Coty’s momentum in growth engine markets, which account for approximately 22% of total sales, continued to be robust with nearly 20% reported growth in FY24 led by strength in Brazil, the rest of LATAM, Southeast Asia, including India, and Africa. LFL growth in FY24 in Coty’s growth engine markets includes a 4% contribution from Argentina, which experienced hyperinflation.
- Coty continued to make progress on its sustainability pillar during Q4, including accelerating supplier engagement in sustainability and improving the Company’s Sustainalytics ESG rating.
Commenting on the operating results, Sue Nabi, Coty’s CEO, said:
“Our FY24 results set a new milestone in Coty’s sustained track record of top-notch execution and market outperformance. In a dynamic macroeconomic backdrop, beauty maintains its privileged position, being neither a consumer goods industry nor a luxury goods industry. Instead, beauty is at the sweet-spot of desire, well-being, self-confidence, affordability, ritual, indulgence, and many new things that we and our consumers will invent. This is what fuels the strong global beauty growth that we continue to see to this day and which we expect to continue for the quarters and years to come.
At Coty, having transformed our organization and strategic path several years ago, we are now performing as a beauty leader and more and more as a beauty trendsetter, which we believe is an opening for a new era for Coty as a beauty powerhouse. Importantly, a key element of this outperformance has been our unwavering strong
investment into our marketing, regardless of the macroeconomic volatility, because we believe that this is what will create value for our brands for the long term.
In a year filled with many milestones for Coty, it’s worth highlighting 4 key achievements of FY24.
First, we once again grew ahead of the underlying beauty market with 11% LFL growth compared to the beauty market growth of approximately 9%, fueled by our leadership in fragrances, strengthened performance in our core cosmetics business, and over-driving our growth channels, markets, and categories. In fact, in 8 out of the last 12 quarters, we have delivered LFL growth which is ahead of the leading global beauty companies. Coty’s consistent outperformance confirms that our top-notch growth is a result of our strategic vision, strong execution and our ability to not only seize but create big and fundamental beauty trends that are here to stay.
Second, we are building unique and hopefully best-in-class expertise in each of our core categories. For example, our unrivaled expertise in fragrances was exemplified by the blockbuster launch of Burberry Goddess, which was not only the biggest fragrance launch in Coty’s history, but also the #1 female fragrance launch for the industry. Goddess is a perfect example of Coty spearheading an industry trend, in this case an exclusive-quality vanilla-based fragrance, which has now rippled into many more vanilla-based fragrance launches first across Coty, including recent mega hits like the ambery-vanilla Cosmic Kylie Jenner, and then also across the broader industry.
Third, we are becoming an advocacy-led company, reaching our consumers through the platforms where they discover newness and build connections with brands. With the earned media value for both Rimmel and CoverGirl over 400% higher than a year ago and closing the gap with leading peers, we are seeing the strong results from this transformation. The next step is co-creating the trends that will shape the global beauty industry in the coming quarters and years.
And fourth, we have once again delivered double digit growth in our LFL sales and adjusted EPS, excluding the swap impact. This marks the third consecutive year of double digit growth in both metrics. Our margins continued to expand supported by premiumization and the strengthening of our business. We reached our mid 60s gross margin percentage target a year ahead of plan, and our FY24 adjusted EBITDA margin expansion of 30 basis points was at the top end of our guidance range. After raising our FY24 guidance 3 times over the past year, we have ended FY24 with results sightly above our raised outlook, reaffirming the steadiness of Coty’s execution. The power of our financial algorithm has been on full display in recent years and reflected in our outlook, anchored on 6-8% LFL revenue growth, 9-11% adjusted EBITDA growth, and close to 20% adjusted EPS growth. And, this is building on the exceptional delivery in FY24 of 11% LFL revenue growth, 12% adjusted EBITDA growth, and 26% adjusted EPS growth excluding the equity swap.
Looking to FY25, we expect our financial results to be consistent with our medium-term algorithm, with our FY25 outlook further reinforced by our white space opportunities, our robust commercial plans, and the strength of our innovation pipeline, including Burberry Goddess Intense, Chloe Signature Intense, Gucci Flora Gorgeous Orchid, Lancaster Golden Lift, CoverGirl Eye Enhancer 3D Mascara and adidas Vibes, the first mass fragrance line designed and scientifically proven to enhance one’s mood.
In sum, we are confident in delivering another year of growth in line with our medium-term targets, steady margin expansion, cash flow improvement and deleveraging progress. As we strengthen our position as a global beauty powerhouse, acting with the agility of smaller brands but also creating the beauty trends of today and tomorrow, Coty remains one of, if not the most compelling investment opportunities in our industry.”
*Adjusted financial metrics used in this release are non-GAAP. See reconciliations of GAAP results to Adjusted results in the accompanying tables.
** E-commerce penetration and contribution based on countries where e-com info is available covering approx. 86% of total Coty. Sources: Circana (Prestige) and Nielsen (CB) May 2024. Additionally, the data includes estimated data for Brick and Click sales, which is subject to change.
RESULTS AT A GLANCE
 (a)LFL results for the three months ended and year ended June 30, 2024 include 1% help from Argentina resulting from significant price increases due to hyperinflation.
* These measures, as well as “free cash flow,” “adjusted earnings before interest, taxes, depreciation and amortization (adjusted EBITDA),” “financial net debt,” and “economic net debt” are Non-GAAP Financial Measures. Refer to “Non-GAAP Financial Measures” for discussion of these measures. Reconciliations from reported to adjusted results can be found at the end of this release.
** Net income for Coty Inc. is net of the Convertible Series B Preferred Stock dividends.
Outlook
Entering FY25, the global beauty market maintains its solid growth, with particular strength in prestige fragrances. Coty is continuing to benefit from these positive trends, with growth across its core categories, a strong innovation pipeline, and sustained progress in key white spaces. The Company anticipates beauty demand in mature markets to expand in the mid-single-digits, including prestige fragrance growth above this range and mass beauty growth below this range, all supported by strong e-commerce momentum, with Coty performing in-line to ahead of the market. At the same time, Coty targets double-digit percentage revenue growth in its growth engine markets and in the high growth travel retail channel, which together account for over 30% of the Company’s business. This will be reinforced by the strength of Coty’s FY25 innovation pipeline, including Burberry Goddess Intense, Chloe Signature Intense, Gucci Flora Gorgeous Orchid, Lancaster Golden Lift, CoverGirl Eye Enhancer 3D Mascara and adidas Vibes, the first mass fragrance line designed and scientifically proven to enhance one’s mood.
These factors are fueling the Company’s expectations for the core business to grow in-line with Coty’s medium-term target range of 6-8% LFL both in FY25 and in 1H25, with LFL growth in Q1 of approximately 6% due to elevated launch-related comparisons in Q1 of last year when LFL revenues grew 18%. This outlook for Q1 and 1H25 reflects sequential growth acceleration from Q4 levels, consistent with the Company’s prior guidance, and reflects a consistent CAGR versus FY22, consistent with the CAGR trends in 3Q and 4Q24. Reported FY25 revenues are expected to include a low-single-digit percentage headwind from FX, and a 1% scope headwind in 1H25 from the divestiture of the Lacoste license.
Coty is targeting FY25 adjusted EBITDA growth of 9-11% to $1,186-1,208 million, ahead of expectations, despite the expected FX headwinds and the profit headwind from the divestiture of the Lacoste license. This implies adjusted EBITDA margin expansion of 10-30 basis points. Within this outlook, Coty expects continued FY25 gross margin expansion year-on-year. Coty targets total FY25 adjusted EPS, excluding equity swap, of $0.54-0.57, implying strong +15-20% growth YoY and a 19-22% CAGR on a 2-year basis, which removes the comparison impact of the 2 cent of net discrete tax benefit in FY24.
Finally, Coty expects FY25 free cash flow to grow by a double-digit percentage YoY to the low to mid $400M range. While in the near-term, the close management of cash and inventory by retailers is contributing to some fluctuation in Coty’s estimated cash flow in 1H25, the Company expects to end CY24 with leverage close to 2.5x. The
Company continues to target further reduction in leverage toward ~2x exiting CY25, as part of its goal to reach an investment grade profile.
Financial Results
Refer to “Non-GAAP Financial Measures” for discussion of the non-GAAP financial measures used in this release; reconciliations from reported to adjusted results can be found at the end of this release.
Revenues:
- FY24 reported net revenues of $6,118.0 million increased 10% year-over-year driven by a strong 13% increase in Prestige reported net revenues and a solid 6% increase in Consumer Beauty reported net revenue. On a LFL basis, net revenues grew 11% driven by a 14% LFL increase in Prestige and a 6% LFL increase in Consumer Beauty.
- 4Q24 reported net revenues of $1,363.4 million increased 1% year-over-year driven by a 2% increase in Consumer Beauty reported net revenues and flattish Prestige reported net revenues. Reported net revenues in Q4 include a 2% headwind from FX and a 2% headwind from the divestiture of the Lacoste license. On a LFL basis, net revenues increased 5% driven by a 6% LFL increase in Prestige and a 4% LFL increase in Consumer Beauty.
Gross Margin:
- FY24 reported and adjusted gross margin of 64.4% increased 50 basis points year-over-year from 63.9%. The rise in reported gross margin was fueled by supply chain savings and the benefit from pricing actions and premiumization, more than offsetting inflationary headwinds.
- 4Q24 reported gross margin of 64.2% increased 130 basis points year-over year from 62.9%. The strong improvement in reported gross margin was fueled by supply chain savings and the benefit from pricing actions and premiumization. 4Q24 adjusted gross margin of 64.2% increased by 140 basis points from 62.8% in the prior year.
Reported Profit:
- FY24 reported operating income of $546.7 million increased 1% and FY24 reported operating margin was 8.9%.
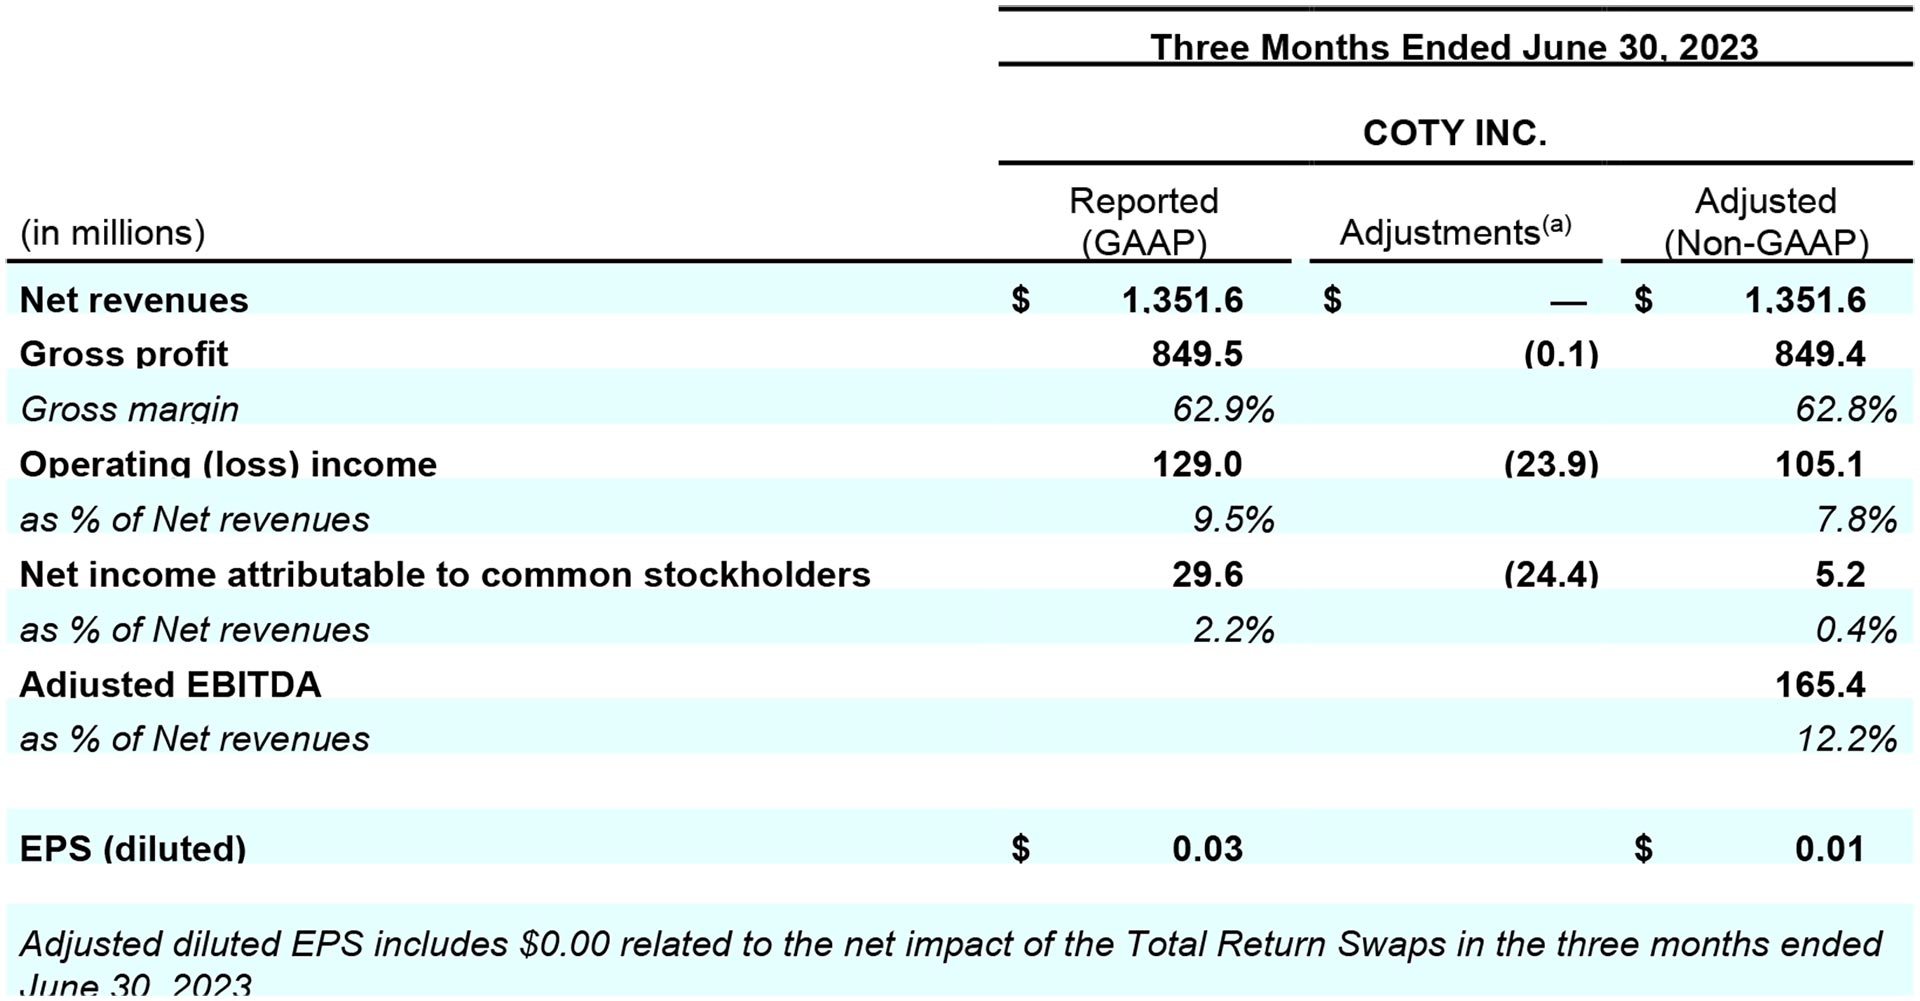
- 4Q24 reported operating income of $34.7 million decreased from $129.0 million the prior year driven by a $104 million cash gain recognized in the prior year related to the divestiture of the Lacoste license. 4Q24 reported operating margin was 2.5% down from 9.5% in the prior year.
- FY24 reported net income of $76.2 million decreased from $495.0 million in the prior year resulting in a reported net income margin of 1.2%, down from 8.9% in the prior year. This margin decline was driven by a higher fair value adjustment in the prior year period to Coty’s investment in Wella and a $233 million reversal in the benefit from the mark-to market on the equity swap, partially offset by a net tax benefit impact of $14 million related to two discrete tax positions in FY24.
- 4Q24 reported net loss of $100.2 million decreased from net income of $29.6 million in the prior year as operating profit expansion and a $38 million discrete tax benefit were more than offset by an $88 million negative impact from the mark-to market on the equity swap compared with a benefit from the mark-to-market on the equity swap in the prior year. 4Q24 reported net loss margin of 7.3% decreased from 2.2% reported net income margin in the prior year.
- FY24 reported EPS of $0.09 decreased from $0.57 in the prior year driven by a higher fair value adjustment for Coty’s investment in Wella recorded in the prior year period and a $0.26 reversal in the benefit from the mark-to-market on the equity swap.
- 4Q24 reported EPS of $(0.12) decreased from $0.03, as profit expansion was more than offset by a $0.10 impact in the current year from the mark-to market on the equity swap.
Adjusted Profit:
- FY24 adjusted operating income of $863.4 million increased 17% from $738.8 million in the prior year. FY24 adjusted operating margin was 14.1%, reflecting strong margin expansion of 80 basis points year-over-year. The improvement in adjusted operating margin was driven by the strong expansion in FY24 gross margin coupled with operating leverage on fixed costs.
- 4Q24 adjusted operating income of $108.0 million increased 3% from $105.1 million in the prior year. 4Q24 adjusted operating margin was 7.9% up from 7.8% in the prior year. The moderate improvement in adjusted operating margin was driven by the strong gross margin expansion partially offset by higher A&CP and fixed costs as the Company reinvested in its strategic growth capabilities.
- FY24 adjusted EBITDA of $1,091.1 million grew 12%, exceeding the Company’s guidance, from $972.8 million in the prior year, while adjusted EBITDA margin of 17.8% increased by 30 basis points year-over-year supported by higher adjusted operating income and gross margin expansion.
- 4Q24 adjusted EBITDA of $164.5 million declined 1% from $165.4 million in the prior year driven by lower adjusted depreciation. Adjusted EBITDA margin of 12.1% decreased by 10 basis points.
- FY24 adjusted net income of $323.1 million decreased from $457.9 million in the prior year driven by a $103.8 million headwind from the mark-to-market on the equity swap in the current year compared with a $128.9 million benefit in the prior year, which resulted in an adjusted net income margin of 5.3%, down from 8.2% in the prior year.
- 4Q24 adjusted net loss of $23.9 million decreased from adjusted net income of $5.2 million in the prior year as profit expansion was more than offset by an $88 million negative impact from the mark-to market on the equity swap. 4Q24 adjusted net loss margin of negative 1.8% decreased from 0.4% in the prior year.
- FY24 adjusted EPS of $0.37 included a non-operating negative impact to EPS of $0.11 from the mark-to-market on the equity swap. This compared to a FY23 adjusted EPS of $0.53, which included a non-operating positive benefit of $0.15 from the mark-to-market on the equity swap in the prior year.
- 4Q24 adjusted EPS of $(0.03) decreased from adjusted EPS of $0.01 in the prior year. 4Q24 adjusted EPS included a negative impact from the equity swap mark-to-market of $0.10 due to the stock price decline in the quarter, compared with a neutral impact from the mark-to-market on the equity swap in the prior year.
Operating Cash Flow:
- FY24 cash flow from operating activities of $614.6 million was moderately lower than the prior year operating cash flows of $625.7 million, despite an approximately $90 million increase in tax payments related to the payment of taxes for prior years.
- FY24 free cash flow totaled $369.4 million, a decrease of $33.5 million year-over-year, reflecting the impact of higher year-over-year capex primarily related to the SAP S/4HANA transition executed successfully at the end of FY24.
- 4Q24 cash from operations of $176.5 million increased from $104.9 million in the prior year driven by a change in phasing of working capital especially on trade payables, partially offset by an increase of tax payments related to the payment of taxes for prior years.
- 4Q24 free cash flow of $116.7 million increased from free cash flow of $38.1 million in the prior year driven by the $71.6 million increase in operating cash flow, and a decrease of $7.0 million in capex.
Financial Net Debt:
- Total debt of $3,913.7 million on June 30, 2024 decreased from $3,972.3 million on March 31, 2024. This resulted in a total debt to net income ratio of 35.8x.
- Financial net debt of $3,612.9 million on June 30, 2024 decreased from $3,712.1 million on March 31, 2024. This resulted in financial leverage of 3.3x, down from 3.4x at the end of the prior quarter.
- The value of Coty’s retained 25.8% Wella stake increased by $5 million to $1,085.0 million at quarter-end, supporting Coty’s economic net debt of $2,527.9 million.
Business Review by Segment
Prestige
In FY24, Prestige net revenues of $3,857.3 million or 63% of Coty sales, grew a strong 13% on a reported basis driven outperformance in EMEA, Latin America, Asia excluding China and the Travel Retail channel. FY24 Prestige net revenues grew a robust 14% on a LFL basis. In 4Q24, Prestige net revenues of $802.8 million were flattish on a reported basis and increased 6% on a LFL basis, which included a mid-single-digit headwind from elevated comparisons in the prior year tied to retailer restocking. Growth in the quarter on a reported basis was impacted by a 4% negative headwind from the divestiture of the Lacoste license and a 2% headwind from FX. This impact was more than offset by continued momentum in prestige beauty demand, which led to growth in most regions with outperformance in Latin America, Asia excluding China and the Travel Retail channel.
Coty’s Prestige fragrance reported net revenues grew by a double-digit percentage in FY24. In FY24, the majority of Coty’s leading Prestige fragrance brands grew reported net revenues by a high-single-digit to a double-digit percentage driven by continued global demand for beauty and fueled by existing icons and new innovations. During Q4, the Prestige fragrance category growth remained strong across North America and Europe, with all major markets expanding led by the U.S., Canada, the U.K., Spain and Italy. The Global Travel Retail channel trends continued to be strong as reported net revenues grew by a double-digit percentage in Q4 with contributions from each region. Reported net revenues for Coty’s Prestige cosmetics business grew by a double-digit percentage in FY24 and a mid-single-digit percentage in Q4 led by Burberry and Kylie Cosmetics.
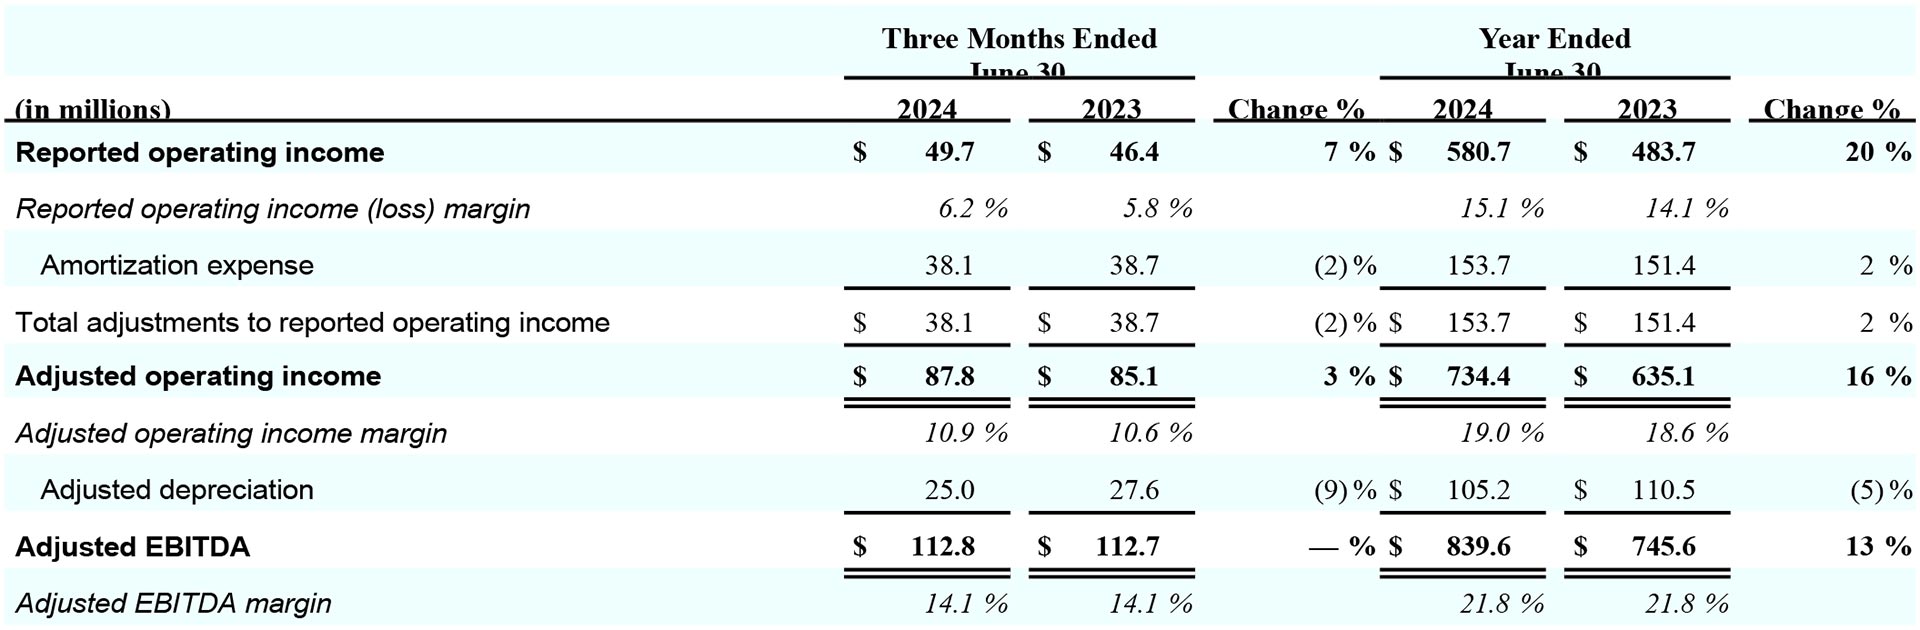
FY24 reported operating income was $580.7 million, compared to $483.7 million in the prior year, with a reported operating margin of 15.1%, which increased 100 basis points year-over-year. The FY24 adjusted operating income increased to $734.4 million from $635.1 million in the prior year, with an adjusted operating margin of 19.0%, up 40 basis points year-over-year. FY24 adjusted EBITDA increased to $839.6 million from $745.6 million in the prior year, with a margin of 21.8%. In 4Q24, the Prestige segment generated reported operating income of $49.7 million, compared to $46.4 million in the prior year, with a reported operating margin of 6.2%. 4Q24 adjusted operating income was $87.8 million, up from $85.1 million in the prior year, with an adjusted operating margin of 10.9%. Q4 adjusted EBITDA rose to $112.8 million, with a margin of 14.1%.
Consumer Beauty
In FY24, Consumer Beauty sales of $2,260.7 million, or 37% of Coty’s net sales, grew by 6% on a reported basis and LFL basis. FY24 reported net revenues grew in all key categories and by a high-single-digit percentage in EMEA and Americas. In 4Q24, Consumer Beauty net revenues of $560.6 million grew 2% as reported, which includes a 2% negative impact from FX, and grew 4% LFL. Consumer Beauty reported growth in Q4 was supported by double-digit percentage growth in mass fragrances and skin & body care, particularly in Brazil. Consumer Beauty’s EMEA region delivered solid reported net revenue growth in the quarter, coupled with strong growth across Latin America, Canada and Asia excluding China.
In FY24 and Q4 on a reported basis, Coty saw strong momentum in most of its key brands, with high-single-digit to double-digit percentage growth across Beckham, Risque, Bruno Banani, Nautica, Bozzano and Paixao.
FY24 reported operating income was $89.3 million, compared to $63.3 million in the prior year, with reported operating margin of 4.0%, which increased by 100 basis points year-over-year. FY24 adjusted operating income increased to $129.0 million from $103.7 million in the prior year, with an adjusted operating margin of 5.7%, which increased 80 basis points year-over-year. FY24 adjusted EBITDA increased to $251.5 million from $227.2 million in the prior year, with a margin of 11.1%, up 50 basis points from 10.6% in the prior year. In 4Q24, the Consumer Beauty segment generated reported operating income of $10.3 million compared with $10.0 million in the prior year, with a reported operating margin of 1.8%, flat year-over-year. 4Q24 adjusted operating income of $20.2 million improved slightly from $20.0 million in the prior year, with an adjusted operating margin of 3.6%, which was flat year-over-year. 4Q24 adjusted EBITDA declined slightly to $51.7 million from $52.7 million, driving adjusted EBITDA margin to decline 30 basis points year-over-year to 9.2%.
Business Review by Region
Americas
- In FY24, Americas net revenue of $2,567.9 million, or 42% of Coty sales, rose 10% on a reported basis and 12% on a LFL basis, including a 2% contribution from Argentina, which experienced hyperinflation. In Q4, revenues in the region grew 3% as reported, which included a 4% FX headwind and a 1% headwind from the divestiture of the Lacoste license, and 8% LFL. The regional performance in both periods was supported by growth in nearly all markets with outsized reported net revenue growth in Latin America, Canada and the regional Travel Retail channel.
EMEA
- In FY24, EMEA net revenue of $2,784.0 million, or 45% of Coty sales, rose 11% on a reported and LFL basis. In Q4, net revenues increased 1% as reported, which included a 1% FX headwind and a 4% headwind from the divestiture of the Lacoste license, and grew 5% LFL. The regional performance across both periods was supported by most markets and the Travel Retail channel.
Asia Pacific
- In FY24, Asia Pacific net revenue of $766.1 million, or 13% of Coty sales, increased 9% as reported and 11% LFL. Asia Pacific net revenues in Q4 declined 4% on a reported basis, which included a 2% headwind from FX, and declined 2% LFL. On a reported basis in both periods, Asia excluding China and the Travel Retail Channel grew by a mid-single-digit to double-digit percentage. In China in Q4, total Company sales were lower due to high prior year comparisons and a very gradual market recovery there.
Noteworthy Company Developments
Other noteworthy company developments include:
- On May 7, 2024, Coty announced that it has signed a new long-term license agreement with German Television Presenter and Model, Lena Gercke to develop, produce, and distribute LeGer’s debut fragrance.
- On May 22, 2024, Coty announced the offering and pricing of €500 million of 4.500% senior secured notes due 2027. Coty intends to use the net proceeds from the offering of the Notes to redeem all of its existing 6.500% Senior Notes due 2026, repay a portion of the borrowings outstanding under its revolving credit facility, without a reduction in commitment, and pay the offering expenses payable by it in connection with the offering of the Notes.
SUPPLEMENTAL SCHEDULES INCLUDING NON-GAAP FINANCIAL MEASURES
FOURTH QUARTER BY SEGMENT (COTY INC)
- LFL results for the three months ended and year ended June 30, 2024 include 1% help from Argentina resulting from significant price increases due to hyperinflation.
 FOURTH QUARTER FISCAL 2024 BY REGION
COTY INC.
- Americas LFL results for the three months ended and year ended June 30, 2024 include 2% help from Argentina resulting from significant price increases due to hyperinflation.
COTY INC. & SUBSIDIARIES
CONDENSED CONSOLIDATED STATEMENTS OF OPERATIONS
- Diluted EPS is adjusted by the effect of dilutive securities, including awards under the Company’s equity compensation plans, the convertible Series B Preferred Stock, and the Forward Repurchase Contracts. When calculating any potential dilutive effect of stock options, Series A Preferred Stock, restricted stock, PRSUs and RSUs, the Company uses the treasury method and the if-converted method for the Convertible Series B Preferred Stock and the Forward Repurchase Contracts. The treasury method typically does not adjust the net income attributable to Coty Inc., while the if-converted method requires an adjustment to reverse the impact of the preferred stock dividends of $13.2, and to reverse the impact of fair market value losses/(gains) for contracts with the option to settle in shares or cash of $73.4 and $(101.8), respectively, if dilutive, for the twelve months ended June 30, 2024 and 2023 on net income applicable to common stockholders during the period. The if-converted method requires an adjustment to reverse the impact of the preferred stock dividends of $3.3, and to reverse the impact of fair market value losses/(gains) for contracts with the option to settle in shares or cash of $67.0 and $1.1, respectively, if dilutive, for the three months ended June 30, 2024, 2023 on net income applicable to common stockholders during the period.
- For the three months ended June 30, 2024 and 2023, outstanding stock options and Series A Preferred Stock with purchase or conversion rights to purchase 3.6 million and 1.9 million weighted average anti-dilutive shares of Common Stock, respectively, were excluded from the computation of diluted EPS. For the twelve months ended June 30, 2024 and 2023, outstanding stock options and Series A Preferred Stock with purchase or conversion rights to purchase 2.8 million and 4.8 million weighted average anti-dilutive shares of Common Stock, respectively, were excluded from the computation of diluted EPS.
RECONCILIATION OF REPORTED TO ADJUSTED RESULTS FOR THE CONSOLIDATED STATEMENTS OF OPERATIONS
These supplemental schedules provide adjusted Non-GAAP financial information and a quantitative reconciliation of the difference between the Non-GAAP financial measure and the financial measure calculated and reported in accordance with GAAP.
 Adjusted diluted EPS includes $0.10 hurt related to the net impact of the Total Return Swaps in the three months ended June 30, 2024.
- See “Reconciliation of Reported Net Income, Adjusted Operating Income and Adjusted EBITDA for Coty Inc” and “Reconciliation of Reported Net Income to Adjusted Net Income” for a detailed description of adjusted items.
RECONCILIATION OF REPORTED TO ADJUSTED RESULTS FOR THE CONSOLIDATED STATEMENTS OF OPERATIONS
These supplemental schedules provide adjusted Non-GAAP financial information and a quantitative reconciliation of the difference between the Non-GAAP financial measure and the financial measure calculated and reported in accordance with GAAP.
 Adjusted diluted EPS includes $0.11 hurt related to the net impact of the Total Return Swaps in the year ended June 30, 2024.
- See “Reconciliation of Reported Net Income to Adjusted Operating Income, and Adjusted EBITDA” and “Reconciliation of Reported Net Income to Adjusted Net Income” for a detailed description of adjusted items.
RECONCILIATION OF REPORTED NET INCOME TO ADJUSTED OPERATING INCOME AND ADJUSTED EBITDA
CONTINUING OPERATIONS
- In the three months ended June 30, 2024, we incurred restructuring and other business structure realignment costs of $7.0. We incurred restructuring costs of $1.7 included in the Condensed Consolidated Statements of Operations, and business structure realignment costs of $5.3 included in Selling, general and administrative expenses, in the Condensed Consolidated Statement of Operations. In the three months ended June 30, 2023, we incurred a credit in restructuring and other business structure realignment costs of $(1.3). We incurred a credit in restructuring costs of $(1.1) included in the Condensed Consolidated Statements of Operations and business structure realignment costs of $(0.2) primarily related to the Transformation Plan. This amount includes $(0.1) reported in Cost of sales and $(0.1) reported in Selling, general and administrative expenses in the Condensed Consolidated Statement of Operations.
In fiscal 2024, we incurred restructuring and other business structure realignment costs of $36.6. We incurred restructuring costs of $36.7 included in the Condensed Consolidated Statements of Operations, related to the Current Restructuring Actions and business structure realignment costs of $(0.1). This amount includes $(0.1) reported in Selling, general and administrative expenses. In fiscal 2023, we incurred a credit restructuring and other business structure realignment costs of $(6.3). We incurred a credit in restructuring costs of $(6.5) included in the Condensed Consolidated Statements of Operations, related to the Transformation Plan, and business structure realignment costs of $0.2 primarily related to the Transformation Plan. This amount includes $0.9 reported in Cost of sales in the Condensed Consolidated Statement of Operations and a credit of $(0.7) reported in Selling, general and administrative expenses. - In the three months ended June 30, 2024, we recognized no gain related to sale of real estate. In the three months ended June 30, 2023, we recognized a gain of $3.9 related to sale of real estate.
In fiscal 2024, we recognized a gain of $1.6 related to sale of real estate. In fiscal 2023, we recognized a gain of $4.9 related to sale of real estate. - In the three months ended June 30, 2024, adjusted depreciation expense of $25.0 and $31.5 was reported in the Prestige and Consumer Beauty segments, respectively. In the three months ended June 30, 2023, adjusted depreciation expense of $27.6 and $32.7 was reported in the Prestige and Consumer Beauty segments, respectively.
In fiscal 2024, adjusted depreciation expense of $105.2 and $122.5 was reported in the Prestige and Consumer Beauty segments, respectively. In fiscal 2023, adjusted depreciation expense of $110.5 and $123.5 was reported in the Prestige and Consumer Beauty segments, respectively. - In the three months ended June 30, 2024, we recognized a gain of $0.1. In the three months ended June 30, 2023, we recognized a gain of $104.4 related to early termination of Lacoste fragrance license.
In fiscal 2024, we recognized a gain of $0.5 related to early termination of Lacoste fragrance license and our decision to wind down our business in Russia. In fiscal 2023, we recognized a gain of $121.4 related to early termination of Lacoste fragrance license.
SEGMENT OPERATING INCOME (LOSS), SEGMENT ADJUSTED OPERATING INCOME (LOSS) AND SEGMENT ADJUSTED EBITDA
OPERATING INCOME, ADJUSTED OPERATING INCOME AND ADJUSTED EBITDA- PRESTIGE SEGMENT
 OPERATING INCOME, ADJUSTED OPERATING INCOME AND ADJUSTED EBITDA- CONSUMER BEAUTY SEGMENT
 OPERATING LOSS, ADJUSTED OPERATING LOSS AND ADJUSTED EBITDA- CORPORATE SEGMENT
RECONCILIATION OF REPORTED INCOME (LOSS) BEFORE INCOME TAXES AND EFFECTIVE TAX RATES TO ADJUSTED INCOME BEFORE INCOME TAXES AND ADJUSTED EFFECTIVE TAX RATES FOR CONTINUING OPERATIONS
 The adjusted effective tax rate was 61.6% for the three months ended June 30, 2024 compared to 62.6% for the three months ended June 30, 2023. The differences were primarily due to an increase in valuation allowances recorded primarily on interest expense carryforwards offset by a tax benefit recorded as a result of the issuance of non-refundable income tax credits received from the Swiss Tax Authorities.
 The adjusted effective tax rate was 26.5% for the fiscal year ended June 30, 2024 compared to 26.4% in the fiscal year ended June 30, 2023. The differences were primarily due to an increase in valuation allowances recorded primarily on interest expense carryforwards and the tax impact of the revaluation of the Company’s deferred tax liabilities due to a tax rate increase enacted in Switzerland offset by a tax benefit recorded as a result of the issuance of non-refundable income tax credits received from the Swiss Tax Authorities and a reduction of unrecognized tax benefits due to the settlement of foreign tax audits.
- See a description of adjustments under “Adjusted Operating Income (Loss) for Coty Inc.”
- The tax effects of each of the items included in adjusted income are calculated in a manner that results in a corresponding income tax expense/provision for adjusted income. In preparing the calculation, each adjustment to reported income is first analyzed to determine if the adjustment has an income tax consequence. The provision for taxes is then calculated based on the jurisdiction in which the adjusted items are incurred, multiplied by the respective statutory rates and offset by the increase or reversal of any valuation allowances commensurate with the non-GAAP measure of profitability. In connection with our decision to wind down our operations in Russia, we recognized tax charges related to certain direct incremental impacts of our decision, which are reflected in this amount, in fiscal 2024 and fiscal 2023.
- The amount represents the realized and unrealized loss (gain) recognized for the change in the fair value of the investment in Wella Company.
- See “Reconciliation of Reported Net Income (Loss) Attributable to Coty Inc to Adjusted Net Income (loss) Attributable to Coty Inc.”
- In fiscal 2024, the total tax impact on adjustments includes a tax expense of $27.6 recorded due to changes to the net deferred taxes recognized on the assignment of strategic service functions from Amsterdam to Geneva, as an indirect result of the required revaluation of the original transfer of the main principal location from Geneva to Amsterdam in fiscal 2021. The total tax impact on adjustments also includes a tax benefit of $1.1, $0.4 for fiscal 2024, fiscal 2023, respectively, recorded as the result of the Company’s exit from Russia.
RECONCILIATION OF REPORTED NET INCOME TO ADJUSTED NET INCOME FOR COTY INC.
- See a description of adjustments under “Adjusted Operating Income (Loss) for Continuing Operations.”
- The amounts represent the after-tax impact of the non-GAAP adjustments included in Net income attributable to noncontrolling interest based on the relevant noncontrolling interest percentage in the Condensed Consolidated Statements of Operations.
- Diluted EPS is adjusted by the effect of dilutive securities, including awards under the Company’s equity compensation plans, the convertible Series B Preferred Stock and the Forward Repurchase Contracts, if applicable. When calculating any potential dilutive effect of stock options, Series A Preferred Stock, restricted stock, PRSUs and RSUs, the Company uses the treasury method and the if-converted method for the Convertible Series B Preferred Stock and the Forward Repurchase Contracts. The treasury method typically does not adjust the net income attributable to Coty Inc. while the if-converted method requires an adjustment to reverse the impact of the preferred stock dividends and the impact of fair market value (gains)/losses for contracts with the option to settle in shares or cash, if dilutive, on net income applicable to common stockholders during the period.
- The amount represents the realized and unrealized gain recognized for the change in the fair value of the investment in Wella Company.
- For the three months ended June 30, 2024, this primarily represents a recovery of previously written-off non-income tax credits and the amortization of basis differences in certain equity method investments. For the three months ended June 30, 2023, this primarily represents the amortization of basis differences in certain equity method investments and pension curtailment gains.
For the twelve months ended June 30, 2024, this primarily represents a recovery of previously written-off non-income tax credits and the amortization of basis differences in certain equity method investments. For the twelve months ended June 30, 2023, this primarily represents the amortization of basis differences in certain equity method investments and pension curtailment gains - For the three months ended June 30, 2024, Convertible Series B Preferred Stock was excluded from the computation of diluted loss per share due to the net loss incurred during the period. For the three months ended June 30, 2023 and the twelve months ended June 30, 2024 and 2023, 23.7 million dilutive shares of Convertible Series B Preferred Stock were excluded in the computation of adjusted weighted-average diluted shares because their effect would be anti-dilutive.
RECONCILIATION OF NET CASH PROVIDED BY OPERATING ACTIVITIES TO FREE CASH FLOW
RECONCILIATION OF TOTAL DEBT TO FINANCIAL NET DEBT AND ECONOMIC NET DEBT
- Total debt is derived from Footnote 14 from the Form 10-K for the fiscal year ended June 30, 2024 and includes both the Company’s short-term and long-term debt (including the current portion of long-term debt).
RECONCILIATION OF TTM(a) NET INCOME TO TTM ADJUSTED EBITDA
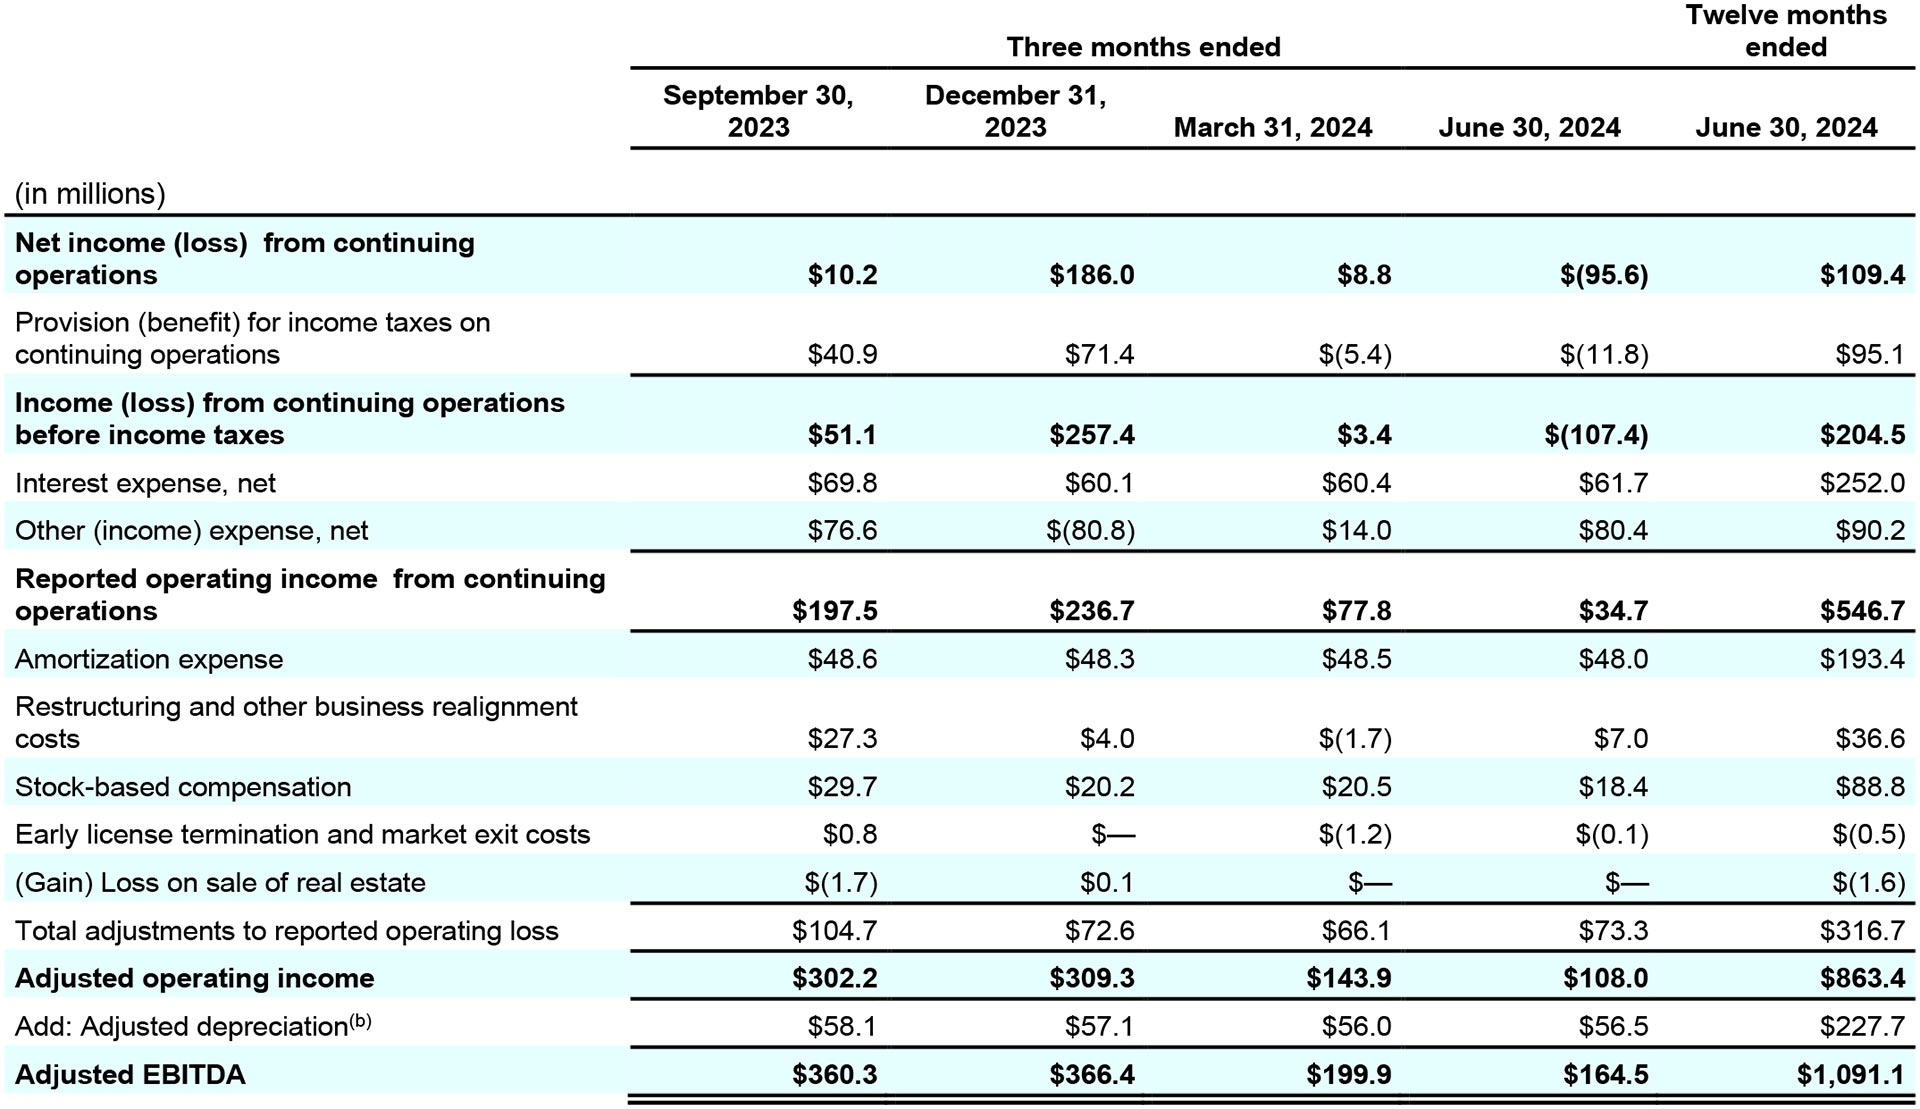
- Trailing twelve months (TTM) net income from continuing operations, reported operating income, adjusted operating income, and adjusted EBITDA represents the summation of each of these financial metrics for the quarters ended June 30, 2024, March 31, 2024, December 31, 2023 and September 30, 2023.
- Adjusted depreciation for the twelve months ended June 30, 2024 represents depreciation expense for Coty Inc for the period, excluding accelerated depreciation.
COMPARISON OF TOTAL DEBT/NET INCOME FROM CONTINUING OPERATIONS TO FINANCIAL NET DEBT/ADJUSTED EBITDA
- TTM adjusted operating income for the twelve months ended June 30, 2024 represents the summation of adjusted operating income for Coty Inc for each of the quarters ended June 30, 2024, March 31, 2024, December 31, 2023 and September 30, 2023. For a reconciliation of adjusted operating income to operating income for Coty Inc. for each of those periods, see the table entitled “Reconciliation of TTM of Net Income to Adjusted Operating Income to Adjusted EBITDA” for each of those periods.
- TTM Net income (loss) from continuing operations for the twelve months ended June 30, 2024 represents the summation of the Net income (loss) from continuing operations for each of the quarters ended June 30, 2024, March 31, 2024, December 31, 2023 and September 30, 2023.
- Financial Net Debt equals Total Debt minus Cash and cash equivalents as of June 30, 2024. See table titled “Reconciliation of Total Debt to Financial Net Debt and Economic Net Debt”.
- Not relevant.
RECONCILIATION OF REPORTED NET REVENUES TO LIKE-FOR-LIKE NET REVENUES
- The Company ceased commercial activities in Russia at the end of the second quarter of fiscal 2023. As a result, there are no revenues from Russia after the end of the second quarter of fiscal 2023. The Company also had an early license termination with Lacoste and concluded the sell-off period at the end of the second quarter of fiscal 2024. In calculating the QTD YoY LFL revenue change, to maintain comparability, we have excluded the fourth quarter of fiscal 2023 Lacoste contribution. In calculating the YTD YoY LFL revenue change, to maintain comparability, we have excluded the first and second quarters fiscal 2023 financial contribution of the Russian subsidiary and the third and fourth quarter of fiscal 2023 Lacoste financial contribution.
- LFL results for the three months ended and year ended June 30, 2024 include 1% help from Argentina resulting from significant price increases due to hyperinflation.
COTY INC. & SUBSIDIARIES
CONDENSED CONSOLIDATED BALANCE SHEETS
COTY INC. & SUBSIDIARIES
CONDENSED CONSOLIDATED STATEMENTS OF CASH FLOWS