All Portfolios
First Quarter 2022 Highlights Versus Prior Year
- Net Sales of $1,041 million, up 19% as reported, and 22% in constant currency
- Reported Gross Margin of 46.4%, a decrease of 70 basis points; Adjusted Gross Margin of 46.6%, a decrease of 70 basis points
- Reported Operating Income of $80 million, up 136%, an increase of $46 million; Adjusted Operating Income of $90 million, up 190%, an increase of $59 million
- Reported Net Income of $21 million, an improvement of $134 million
- Reported EPS of $0.06, an improvement of $0.38 per share; Adjusted EPS of $0.08, an improvement of $0.18 per share
- Adjusted EBITDA of $152 million, up 65%, an increase of $60 million
- Company reiterates 2022 guidance and 2023 goals
El Segundo, CA — Mattel, Inc. reported first quarter financial results.
Ynon Kreiz, Chairman and CEO of Mattel, said: “Mattel achieved its highest first quarter results we have on record for net sales, operating income, and EBITDA. Our strong performance continued, with growth across regions, categories, and our three power brands. These results are in line with our strategy to grow Mattel’s IP-driven toy business. Having completed our turnaround in 2021, we are firmly in growth mode and operating as an IP-driven, high-performing toy company.”
Mr. Kreiz continued: “Mattel’s supply chain is playing a key role in our success. All of our factories are fully operational, and we are working with our retail partners to ensure product is available on shelves to meet consumer demand. The full-year outlook is strong, we expect to grow market share, and we are reiterating our 2022 guidance and 2023 goals.”
Anthony DiSilvestro, CFO of Mattel, said: “Mattel executed another outstanding quarter, and we are very pleased with the start of the year. Our topline performance benefited from increased points of distribution, as well as retailers restocking low inventories following the strong holiday season and gearing up to support product launches tied to the upcoming theatrical releases. Looking ahead, we continue to expect to grow net sales in 2022 by 8-10% in constant currency, driven by growth in our leader categories, led by our power brands and American Girl, as well as our Challenger categories. We expect to achieve strong growth in the second quarter, and to continue to improve free cash flow, conversion rate, and leverage ratio for the full year.”
Financial Overview
First Quarter 2022
For the first quarter, Net Sales were up 19% as reported, and 22% in constant currency, versus the prior year’s first quarter. Reported Operating Income was $80 million, an increase of $46 million, and Adjusted Operating Income was $90 million, an increase of $59 million. Reported Earnings Per Share were $0.06, an improvement of $0.38 per share, and Adjusted Earnings Per Share were $0.08, an improvement of $0.18 per share.
Net Sales in the North America segment increased 26% as reported and in constant currency, versus the prior year’s first quarter.
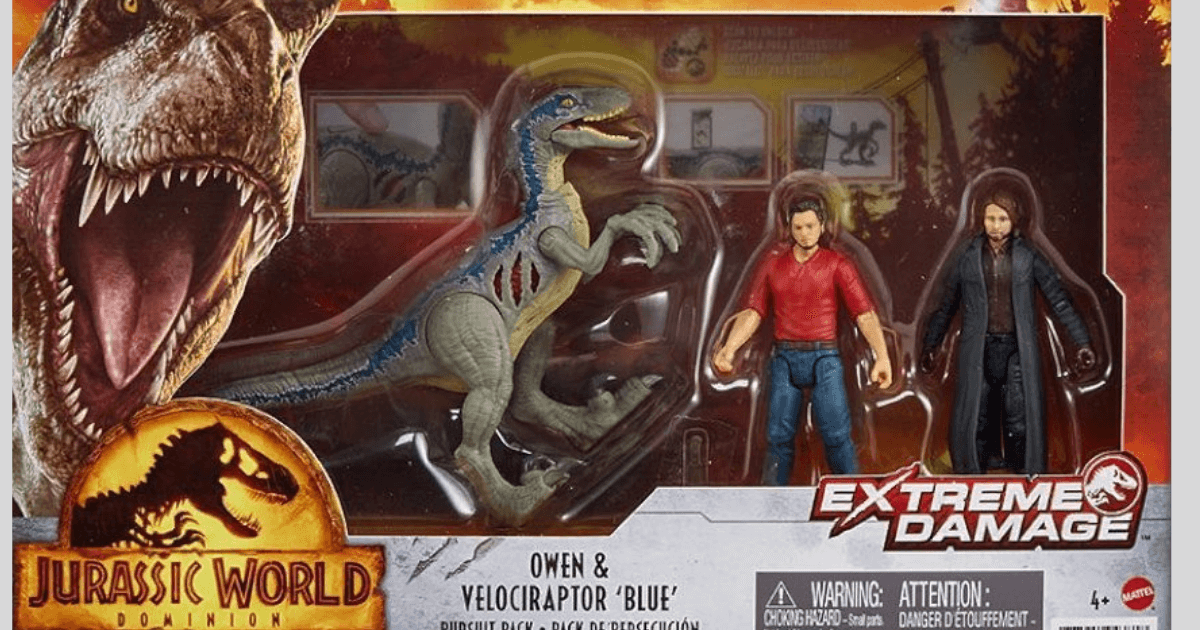
Gross Billings in the North America segment increased 25% as reported and in constant currency, driven by growth in Action Figures, Building Sets, Games, and Other (including Jurassic World™, Lightyear, and MEGA®), Vehicles (including Hot Wheels®), Infant, Toddler, and Preschool (including Fisher-Price® and Thomas & Friends™), and Dolls (including Barbie® and Polly Pocket®).
Net Sales in the International segment increased 16% as reported, and 24% in constant currency.
Gross Billings in the International segment increased 16% as reported, and 24% in constant currency, driven by growth in Vehicles (including Hot Wheels), Dolls (including Barbie and Polly Pocket), and Action Figures, Building Sets, Games, and Other (including Jurassic World, MEGA, and Lightyear).
Net Sales in the American Girl® segment decreased 22% as reported and in constant currency.
Gross Billings in the American Girl segment decreased 22% as reported and in constant currency, compared to a very strong prior year.
Reported Gross Margin decreased to 46.4%, versus 47.1% in the prior year’s first quarter. Adjusted Gross Margin decreased to 46.6%, versus 47.3% in the prior year’s first quarter. The decrease in Reported and Adjusted Gross Margin was primarily due to input cost inflation, partially offset by favorable foreign exchange, pricing, favorable fixed cost absorption, and savings from the Optimizing for Growth program.
Reported Other Selling and Administrative Expenses increased by $25 million versus the prior year to $329 million. Adjusted Other Selling and Administrative Expenses increased by $13 million to $322 million. The increase in Adjusted Other Selling and Administrative Expenses was primarily due to higher employee-related expenses, partially offset by savings from the Optimizing for Growth program.
For the three months ended March 31, 2022, Cash Flows Used for Operating Activities were $144 million, an increase of $108 million, versus the prior year’s first quarter, primarily due to higher working capital usage, partially offset by higher net income, excluding the impact of non-cash charges. Cash Flows Used for Investing Activities were $55 million, an increase of $56 million, primarily due to the impact of prior year proceeds from the disposal of assets and a business and higher net payments of foreign currency forward contracts. Cash Flows Provided by Financing Activities and Other were $4 million, as compared to a use of $112 million in the prior year’s first quarter, with the change primarily due to the cash used for repayment and refinancing of long-term borrowings in the first quarter of 2021.
Gross Billings by Categories
First Quarter 2022
Worldwide Gross Billings for Dolls were $396 million, up 4% as reported, and 8% in constant currency, versus the prior year’s first quarter, primarily driven by growth in Barbie and Polly Pocket, partially offset by declines in American Girl.
Worldwide Gross Billings for Infant, Toddler, and Preschool were $206 million, up 12% as reported, and 15% in constant currency, primarily driven by growth in Fisher-Price and Thomas & Friends.
Worldwide Gross Billings for Vehicles were $282 million, up 31% as reported, and 36% in constant currency, primarily driven by growth in Hot Wheels.
Worldwide Gross Billings for Action Figures, Building Sets, Games, and Other were $281 million, up 41% as reported, and 44% in constant currency, primarily driven by growth in Action Figures (including Jurassic World and Lightyear) and Building Sets (including MEGA).
2022 Guidance and 2023 Goals
Mattel’s 2022 guidance remains as follows:
(in millions,
except EPS and percentages) |
|
FY2022 Expected |
|
FY2021 |
|
|
|
|
|
| Net Sales |
|
+8 – 10%
(Constant Currency) |
|
$5,458 |
| Adjusted Gross Margin |
|
~47% |
|
48.2% |
| Adjusted EBITDA |
|
$1,100 – $1,125 |
|
$1,007 |
| Adjusted EPS |
|
$1.42 – $1.48 |
|
$1.30 |
| Adjusted Tax Rate |
|
26 – 28% |
|
25% |
| Capital Expenditures |
|
$175 – $200 |
|
$151 |
Mattel’s 2023 goals remain as follows:
|
|
FY2023 |
|
|
|
| Net Sales |
|
+ High-Single Digit %
(Constant Currency) |
| Adjusted Operating Income Margin |
|
~16 – 17%
of Net Sales |
| Adjusted EPS |
|
> $1.90 |
MAT-FIN MAT-CORP
| MATTEL, INC. AND SUBSIDIARIES |
|
|
|
|
|
|
|
|
|
|
EXHIBIT I |
|
|
|
|
|
|
|
|
|
|
|
|
| CONSOLIDATED STATEMENTS OF OPERATIONS (Unaudited)1 |
|
|
|
|
|
|
|
|
|
|
|
|
|
|
|
|
|
|
|
|
|
|
|
|
For the Three Months Ended March 31, |
|
2022 |
|
20212 |
|
% Change as
Reported |
|
% Change in Constant
Currency |
| (In millions, except per share and percentage information) |
$ Amt |
|
% Net Sales |
|
$ Amt |
|
% Net Sales |
|
|
| Net Sales |
$ |
1,041.3 |
|
|
|
|
$ |
874.2 |
|
|
|
|
19 |
% |
|
22 |
% |
| Cost of Sales |
|
558.4 |
|
|
53.6 |
% |
|
|
462.4 |
|
|
52.9 |
% |
|
21 |
% |
|
|
| Gross Profit |
|
482.9 |
|
|
46.4 |
% |
|
|
411.8 |
|
|
47.1 |
% |
|
17 |
% |
|
17 |
% |
| Advertising and Promotion Expenses |
|
73.8 |
|
|
7.1 |
% |
|
|
74.1 |
|
|
8.5 |
% |
|
0 |
% |
|
|
| Other Selling and Administrative Expenses |
|
329.1 |
|
|
31.6 |
% |
|
|
303.9 |
|
|
34.8 |
% |
|
8 |
% |
|
|
| Operating Income |
|
80.1 |
|
|
7.7 |
% |
|
|
33.9 |
|
|
3.9 |
% |
|
136 |
% |
|
88 |
% |
| Interest Expense |
|
33.0 |
|
|
3.2 |
% |
|
|
130.5 |
|
|
14.9 |
% |
|
-75 |
% |
|
|
| Interest (Income) |
|
(1.2 |
) |
|
-0.1 |
% |
|
|
(0.8 |
) |
|
-0.1 |
% |
|
47 |
% |
|
|
| Other Non-Operating Expense (Income), Net |
|
9.1 |
|
|
|
|
|
(1.1 |
) |
|
|
|
|
|
|
| Income (Loss) Before Income Taxes |
|
39.1 |
|
|
3.8 |
% |
|
|
(94.7 |
) |
|
-10.8 |
% |
|
n/m |
|
|
n/m |
|
| Provision for Income Taxes |
|
23.9 |
|
|
|
|
|
20.3 |
|
|
|
|
|
|
|
| (Income) from Equity Method Investments |
|
(6.3 |
) |
|
|
|
|
(2.6 |
) |
|
|
|
|
|
|
| Net Income (Loss) |
$ |
21.5 |
|
|
2.1 |
% |
|
$ |
(112.4 |
) |
|
-12.9 |
% |
|
n/m |
|
|
|
| Net Income (Loss) Per Common Share – Basic |
$ |
0.06 |
|
|
|
|
$ |
(0.32 |
) |
|
|
|
|
|
|
| Weighted-Average Number of Common Shares |
|
352.2 |
|
|
|
|
|
349.0 |
|
|
|
|
|
|
|
| Net Income (Loss) Per Common Share – Diluted |
$ |
0.06 |
|
|
|
|
$ |
(0.32 |
) |
|
|
|
|
|
|
| Weighted-Average Number of Common and Potential Common Shares |
|
359.0 |
|
|
|
|
|
349.0 |
|
|
|
|
|
|
|
| 1 Amounts may not sum due to rounding. |
| 2 Reflects the impact of immaterial revisions to the financial statements. |
| n/m – Not meaningful |
| MATTEL, INC. AND SUBSIDIARIES |
|
|
|
|
|
|
|
EXHIBIT II |
|
|
|
|
|
|
|
|
|
|
|
| CONDENSED CONSOLIDATED BALANCE SHEETS1 |
|
|
|
|
|
|
|
|
|
|
|
|
|
|
|
|
|
|
|
|
|
|
|
March 31, |
|
December 31, |
|
|
|
|
|
|
2022 |
|
20212 |
|
2021 |
| (In millions) |
|
|
|
|
|
(Unaudited) |
|
|
| Assets |
|
|
|
|
|
|
|
|
|
|
| Cash and Equivalents |
|
|
|
|
$ |
536.6 |
|
$ |
615.2 |
|
|
$ |
731.4 |
|
| Accounts Receivable, Net |
|
|
|
|
|
862.2 |
|
|
680.6 |
|
|
|
1,072.7 |
|
| Inventories |
|
|
|
|
|
|
969.2 |
|
|
626.5 |
|
|
|
777.2 |
|
| Prepaid Expenses and Other Current Assets |
|
|
|
267.7 |
|
|
187.2 |
|
|
|
293.3 |
|
| Total Current Assets |
|
|
|
|
|
2,635.7 |
|
|
2,109.5 |
|
|
|
2,874.5 |
|
| Property, Plant, and Equipment, Net |
|
|
|
|
452.0 |
|
|
451.0 |
|
|
|
456.0 |
|
| Right-of-Use Assets, Net |
|
|
|
|
|
339.7 |
|
|
294.8 |
|
|
|
325.5 |
|
| Goodwill |
|
|
|
|
|
|
1,387.1 |
|
|
1,392.3 |
|
|
|
1,390.2 |
|
| Other Noncurrent Assets |
|
|
|
|
|
1,332.9 |
|
|
871.3 |
|
|
|
1,347.7 |
|
| Total Assets |
|
|
|
|
|
$ |
6,147.4 |
|
$ |
5,118.9 |
|
|
$ |
6,393.9 |
|
|
|
|
|
|
|
|
|
|
|
|
| Liabilities and Stockholders’ Equity |
|
|
|
|
|
|
|
|
| Short-Term Borrowings |
|
|
|
|
$ |
– |
|
$ |
0.9 |
|
|
$ |
– |
|
| Current Portion of Long-Term Debt |
|
|
|
|
250.0 |
|
|
– |
|
|
|
– |
|
| Accounts Payable and Accrued Liabilities |
|
|
|
|
1,278.0 |
|
|
1,051.6 |
|
|
|
1,570.7 |
|
| Income Taxes Payable |
|
|
|
|
|
16.7 |
|
|
30.1 |
|
|
|
27.5 |
|
| Total Current Liabilities |
|
|
|
|
|
1,544.7 |
|
|
1,082.6 |
|
|
|
1,598.3 |
|
| Long-Term Debt |
|
|
|
|
|
|
2,322.1 |
|
|
2,837.7 |
|
|
|
2,571.0 |
|
| Noncurrent Lease Liabilities |
|
|
|
|
|
296.4 |
|
|
255.7 |
|
|
|
283.6 |
|
| Other Noncurrent Liabilities |
|
|
|
|
|
366.1 |
|
|
452.4 |
|
|
|
372.2 |
|
| Stockholders’ Equity |
|
|
|
|
|
1,618.1 |
|
|
490.6 |
|
|
|
1,568.8 |
|
| Total Liabilities and Stockholders’ Equity |
|
|
$ |
6,147.4 |
|
$ |
5,118.9 |
|
|
$ |
6,393.9 |
|
|
|
|
|
|
|
|
|
|
|
|
|
|
|
|
|
|
|
|
|
|
|
| MATTEL, INC. AND SUBSIDIARIES |
|
|
|
|
|
|
|
|
|
|
|
|
|
|
|
|
|
|
|
| SUPPLEMENTAL BALANCE SHEET AND CASH FLOW DATA (Unaudited)1 |
|
|
|
|
|
|
|
|
|
|
|
|
|
|
|
|
|
|
|
|
|
|
|
|
|
March 31, |
|
|
|
|
|
|
|
|
2022 |
|
2021 |
| Key Balance Sheet Data: |
|
|
|
|
|
|
|
|
|
| Accounts Receivable, Net Days of Sales Outstanding (DSO) |
|
|
|
|
75 |
|
|
|
70 |
|
|
|
|
|
|
|
|
|
|
|
|
|
|
|
|
|
|
|
|
For the Three Months Ended March 31, |
| (In millions) |
|
|
|
|
|
|
|
2022 |
|
20212 |
| Condensed Cash Flow Data: |
|
|
|
|
|
|
|
|
|
| Cash Flows Used for Operating Activities |
|
|
|
|
|
$ |
(144 |
) |
|
$ |
(36 |
) |
| Cash Flows (Used for) Provided by Investing Activities |
|
|
|
|
|
(55 |
) |
|
|
1 |
|
| Cash Flows Provided by (Used for) Financing Activities and Other |
|
|
|
|
4 |
|
|
|
(112 |
) |
| Decrease in Cash and Equivalents |
|
|
|
$ |
(195 |
) |
|
$ |
(147 |
) |
| 1 Amounts may not sum due to rounding. |
| 2 Reflects the impact of immaterial revisions to the financial statements. |
| MATTEL, INC. AND SUBSIDIARIES |
|
|
|
|
|
|
EXHIBIT III |
|
|
|
|
|
|
|
|
|
|
|
| SUPPLEMENTAL FINANCIAL INFORMATION (Unaudited)1 |
|
|
|
|
|
|
| RECONCILIATION OF GAAP AND NON-GAAP FINANCIAL MEASURES |
|
|
|
|
|
|
|
|
|
|
|
|
|
|
|
|
|
|
|
|
|
|
|
For the Three Months Ended March 31, |
| (In millions, except percentage information) |
|
2022 |
|
20212 |
|
Change |
| Gross Profit |
|
|
|
|
|
|
|
|
|
|
| Gross Profit, As Reported |
|
|
|
|
|
$ 482.9 |
|
$ 411.8 |
|
|
| Gross Margin |
|
|
|
|
46.4% |
|
47.1% |
|
-70 bps |
| Adjustments: |
|
|
|
|
|
|
|
|
|
|
| Severance and Restructuring Expenses |
|
|
2.7 |
|
1.9 |
|
|
| Gross Profit, As Adjusted |
|
|
|
|
|
$ 485.6 |
|
$ 413.8 |
|
|
| Adjusted Gross Margin |
|
|
|
|
46.6% |
|
47.3% |
|
-70 bps |
|
|
|
|
|
|
|
|
|
|
|
| Other Selling and Administrative Expenses |
|
|
|
|
|
|
| Other Selling and Administrative Expenses, As Reported |
|
$ 329.1 |
|
$ 303.9 |
|
8% |
| % of Net Sales |
|
|
|
|
31.6% |
|
34.8% |
|
|
| Adjustments: |
|
|
|
|
|
|
|
|
|
| Severance and Restructuring Expenses |
|
|
(6.8) |
|
(5.7) |
|
|
| Inclined Sleeper Product Recalls3 |
|
|
(0.6) |
|
(5.3) |
|
|
| Sale of Assets4 |
|
|
|
|
– |
|
15.8 |
|
|
| Other Selling and Administrative Expenses, As Adjusted |
|
$ 321.7 |
|
$ 308.6 |
|
4% |
| % of Net Sales |
|
|
|
|
30.9% |
|
35.3% |
|
|
|
|
|
|
|
|
|
|
|
|
|
| Operating Income |
|
|
|
|
|
|
|
|
|
| Operating Income, As Reported |
|
|
|
$ 80.1 |
|
$ 33.9 |
|
136% |
| Operating Income Margin |
|
|
|
7.7% |
|
3.9% |
|
380 bps |
| Adjustments: |
|
|
|
|
|
|
|
|
|
| Severance and Restructuring Expenses |
|
|
9.5 |
|
7.6 |
|
|
| Inclined Sleeper Product Recalls3 |
|
|
0.6 |
|
5.3 |
|
|
| Sale of Assets4 |
|
|
|
|
– |
|
(15.8) |
|
|
| Operating Income, As Adjusted |
|
|
|
$ 90.1 |
|
$ 31.0 |
|
190% |
| Adjusted Operating Income Margin |
|
|
|
|
8.7% |
|
3.5% |
|
520 bps |
| 1 Amounts may not sum due to rounding. |
| 2 Reflects the impact of immaterial revisions to the financial statements. |
| 3 For the three months ended March 31, 2022 and 2021, represents expenses related to inclined sleeper product recall litigation. |
| 4 For the three months ended March 31, 2021, Mattel recorded a gain on sale of assets of $15.8 million in other selling and administrative expenses. |
| MATTEL, INC. AND SUBSIDIARIES |
|
|
|
|
|
|
|
|
|
|
|
| SUPPLEMENTAL FINANCIAL INFORMATION (Unaudited)1 |
|
|
|
|
|
|
| RECONCILIATION OF GAAP AND NON-GAAP FINANCIAL MEASURES |
|
|
|
|
|
|
|
|
|
|
|
|
|
|
|
|
|
|
|
|
|
|
|
For the Three Months Ended March 31, |
| (In millions, except per share and percentage information) |
|
2022 |
|
20212 |
|
Change |
| Earnings Per Share |
|
|
|
|
|
|
|
|
|
| Net Income (Loss) Per Common Share, As Reported |
|
$ |
0.06 |
|
|
$ |
(0.32 |
) |
|
n/m |
|
| Adjustments: |
|
|
|
|
|
|
|
|
|
| Severance and Restructuring Expenses |
|
|
|
0.03 |
|
|
|
0.02 |
|
|
|
| Inclined Sleeper Product Recalls3 |
|
|
|
– |
|
|
|
0.02 |
|
|
|
| Sale of Assets/Business4 |
|
|
|
|
– |
|
|
|
(0.06 |
) |
|
|
| Loss on Debt Extinguishment |
|
|
|
– |
|
|
|
0.24 |
|
|
|
| Tax Effect of Adjustments5 |
|
|
|
|
(0.01 |
) |
|
|
0.01 |
|
|
|
| Net Income (Loss) Per Common Share, As Adjusted |
|
$ |
0.08 |
|
|
$ |
(0.10 |
) |
|
n/m |
|
|
|
|
|
|
|
|
|
|
|
|
| EBITDA and Adjusted EBITDA |
|
|
|
|
|
|
|
|
| Net Income (Loss), As Reported |
|
|
|
$ |
21.5 |
|
|
$ |
(112.4 |
) |
|
n/m |
|
| Adjustments: |
|
|
|
|
|
|
|
|
|
| Interest Expense |
|
|
|
|
|
33.0 |
|
|
|
130.5 |
|
|
|
| Provision for Income Taxes |
|
|
|
|
23.9 |
|
|
|
20.3 |
|
|
|
| Depreciation |
|
|
|
|
|
35.9 |
|
|
|
36.5 |
|
|
|
| Amortization |
|
|
|
|
|
9.3 |
|
|
|
9.5 |
|
|
|
| EBITDA |
|
|
|
|
|
|
123.6 |
|
|
|
84.5 |
|
|
|
| Adjustments: |
|
|
|
|
|
|
|
|
|
| Share-Based Compensation |
|
|
|
|
19.3 |
|
|
|
15.1 |
|
|
|
| Severance and Restructuring Expenses |
|
|
|
8.4 |
|
|
|
7.0 |
|
|
|
| Inclined Sleeper Product Recalls3 |
|
|
|
0.6 |
|
|
|
5.3 |
|
|
|
| Sale of Assets/Business4 |
|
|
|
|
– |
|
|
|
(19.7 |
) |
|
|
| Adjusted EBITDA |
|
|
|
|
$ |
152.0 |
|
|
$ |
92.2 |
|
|
65 |
% |
|
|
|
|
|
|
|
|
|
|
|
| Free Cash Flow |
|
|
|
|
|
|
|
|
|
| Net Cash Flows Used for Operating Activities |
|
$ |
(143.8 |
) |
|
$ |
(35.7 |
) |
|
|
| Capital Expenditures |
|
|
|
|
|
(36.0 |
) |
|
|
(35.8 |
) |
|
|
| Free Cash Flow |
|
|
|
|
$ |
(179.8 |
) |
|
$ |
(71.5 |
) |
|
|
| 1 Amounts may not sum due to rounding. |
| 2 Reflects the impact of immaterial revisions to the financial statements. |
| 3 For the three months ended March 31, 2022 and 2021, represents expenses related to inclined sleeper product recall litigation. |
| 4 For the three months ended March 31, 2021, Mattel recorded a gain on sale of assets of $15.8 million in other selling and administrative expenses, and a gain on sale of business of $3.9 million in other non-operating expense (income), net. |
| 5 The aggregate tax effect of the adjustments is calculated by tax effecting the adjustments by the current effective tax rate, and dividing by the reported weighted average number of common and potential common shares. |
| n/m – Not meaningful |
| MATTEL, INC. AND SUBSIDIARIES |
|
|
|
|
|
|
|
|
|
|
|
| SUPPLEMENTAL FINANCIAL INFORMATION (Unaudited)1 |
|
|
|
|
|
|
| RECONCILIATION OF GAAP AND NON-GAAP FINANCIAL MEASURES |
|
|
|
|
|
|
|
|
|
|
|
|
For the Trailing Twelve Months Ended March 31, |
| (In millions, except percentage and pts information) |
|
2022 |
|
20212 |
|
Change |
| Leverage Ratio (Debt / Adjusted EBITDA) |
|
|
|
|
|
|
|
| Debt |
|
|
|
|
|
|
|
|
|
|
| Long-Term Debt |
|
|
|
|
$ |
2,322.1 |
|
|
$ |
2,837.7 |
|
|
|
| Current Portion of Long-Term Debt |
|
|
|
250.0 |
|
|
|
– |
|
|
|
| Short-Term Borrowings |
|
|
|
|
– |
|
|
|
0.9 |
|
|
|
| Adjustments: |
|
|
|
|
|
|
|
|
|
| Debt Issuance Costs and Debt Discount |
|
|
|
27.9 |
|
|
|
37.3 |
|
|
|
| Debt |
|
|
|
|
|
$ |
2,600.0 |
|
|
$ |
2,875.9 |
|
|
|
| EBITDA and Adjusted EBITDA |
|
|
|
|
|
|
|
|
| Net Income, As Reported |
|
|
|
$ |
1,036.8 |
|
|
$ |
216.9 |
|
|
378 |
% |
| Adjustments: |
|
|
|
|
|
|
|
|
|
| Interest Expense |
|
|
|
|
|
156.5 |
|
|
|
279.8 |
|
|
|
| (Benefit) Provision for Income Taxes |
|
|
|
(416.8 |
) |
|
|
74.0 |
|
|
|
| Depreciation |
|
|
|
|
|
145.6 |
|
|
|
147.4 |
|
|
|
| Amortization |
|
|
|
|
|
37.8 |
|
|
|
38.5 |
|
|
|
| EBITDA |
|
|
|
|
|
|
960.0 |
|
|
|
756.6 |
|
|
|
| Adjustments: |
|
|
|
|
|
|
|
|
|
| Share-Based Compensation |
|
|
|
|
64.3 |
|
|
|
61.0 |
|
|
|
| Severance and Restructuring Expenses |
|
|
|
32.1 |
|
|
|
35.9 |
|
|
|
| Inclined Sleeper Product Recalls |
|
|
|
10.4 |
|
|
|
25.2 |
|
|
|
| Sale of Assets/Business |
|
|
|
|
– |
|
|
|
(19.7 |
) |
|
|
| Adjusted EBITDA |
|
|
|
|
$ |
1,066.8 |
|
|
$ |
858.9 |
|
|
24 |
% |
|
|
|
|
|
|
|
|
|
|
|
| Debt / Net Income |
|
|
|
|
2.5x |
|
13.3x |
|
|
| Leverage Ratio (Debt / Adjusted EBITDA) |
|
|
2.4x |
|
3.3x |
|
|
|
|
|
|
|
|
|
|
|
|
|
| Free Cash Flow |
|
|
|
|
|
|
|
|
|
| Net Cash Flows Provided by Operating Activities |
|
$ |
377.4 |
|
|
$ |
427.4 |
|
|
-12 |
% |
| Capital Expenditures |
|
|
|
|
|
(151.6 |
) |
|
|
(122.3 |
) |
|
|
| Free Cash Flow |
|
|
|
|
$ |
225.8 |
|
|
$ |
305.2 |
|
|
-26 |
% |
|
|
|
|
|
|
|
|
|
|
|
| Net Cash Flows Provided by Operating Activities / Net Income |
|
|
36 |
% |
|
|
197 |
% |
|
(161) pts |
| Free Cash Flow Conversion (Free Cash Flow/Adjusted EBITDA) |
|
|
21 |
% |
|
|
36 |
% |
|
(15) pts |
| 1 Amounts may not sum due to rounding. |
| 2 Reflects the impact of immaterial revisions to the financial statements. |
| MATTEL, INC. AND SUBSIDIARIES |
|
|
|
|
|
|
|
| SUPPLEMENTAL FINANCIAL INFORMATION (Unaudited)1 |
|
|
| RECONCILIATION OF GAAP AND NON-GAAP FINANCIAL MEASURES |
|
|
|
|
|
|
|
|
For the Year Ended
December 31, |
| (In millions, except percentage and per share information) |
|
2021 |
| Gross Profit |
|
|
|
|
|
|
| Gross Profit, As Reported |
|
|
|
|
|
$ 2,626.7 |
| Gross Margin |
|
|
|
|
48.1% |
| Adjustments: |
|
|
|
|
|
|
| Severance and Restructuring Expenses |
|
|
2.9 |
| Gross Profit, As Adjusted |
|
|
|
|
|
$ 2,629.5 |
| Adjusted Gross Margin |
|
|
|
|
|
48.2% |
|
|
|
|
|
|
|
| Earnings Per Share |
|
|
|
|
|
| Net Income Per Common Share, As Reported |
|
$ 2.53 |
| Adjustments: |
|
|
|
|
|
| Severance and Restructuring Expenses |
|
|
0.10 |
| Inclined Sleeper Product Recalls2 |
|
|
0.04 |
| Sale of Assets/Business3 |
|
|
|
(0.06) |
| Loss on Debt Extinguishment |
|
|
0.28 |
| Valuation Allowance Releases4 |
|
|
(1.51) |
| Tax Effect of Adjustments5 |
|
|
|
(0.08) |
| Net Income Per Common Share, As Adjusted |
|
$ 1.30 |
|
|
|
|
|
|
|
| EBITDA and Adjusted EBITDA |
|
|
|
|
| Net Income, As Reported |
|
|
|
$ 903.0 |
| Adjustments: |
|
|
|
|
|
| Interest Expense |
|
|
|
|
253.9 |
| (Benefit) for Income Taxes |
|
|
|
(420.4) |
| Depreciation |
|
|
|
|
146.3 |
| Amortization |
|
|
|
|
38.0 |
| EBITDA |
|
|
|
|
|
920.9 |
| Adjustments: |
|
|
|
|
|
| Share-Based Compensation |
|
|
|
60.1 |
| Severance and Restructuring Expenses |
|
|
30.7 |
| Inclined Sleeper Product Recalls2 |
|
|
15.1 |
| Sale of Assets/Business3 |
|
|
|
(19.7) |
| Adjusted EBITDA |
|
|
|
|
$ 1,007.0 |
| 1 Amounts may not sum due to rounding. |
| 2 For the year ended December 31, 2021, represents expenses related to inclined sleeper product recall litigation. |
| 3 For the year ended December 31, 2021, Mattel recorded a gain on sale of assets of $15.8 million in other selling and administrative expenses, and a gain on sale of business of $3.9 million in other non-operating expense, net. |
| 4 For the year ended December 31, 2021, the amount includes a net benefit of approximately $541 million, related to the release of valuation allowances against deferred tax assets of the U.S. and certain International affiliates. |
| 5 The aggregate tax effect of the adjustments is calculated by tax effecting the adjustments by the current effective tax rate, and dividing by the reported weighted average number of common and potential common shares. |
| MATTEL, INC. AND SUBSIDIARIES |
|
|
|
|
|
|
|
| SUPPLEMENTAL FINANCIAL INFORMATION (Unaudited)1 |
|
|
| RECONCILIATION OF GAAP AND NON-GAAP FINANCIAL MEASURES |
|
|
|
|
|
|
|
|
For the Year Ended
December 31, |
| (In millions, except percentage information) |
|
2021 |
| Tax Rate |
|
|
|
|
|
|
| Income before Income Taxes, As Reported |
|
|
$ |
470.8 |
|
| Adjustments: |
|
|
|
|
|
| Severance and Restructuring Expenses |
|
|
|
34.4 |
|
| Inclined Sleeper Product Recalls2 |
|
|
|
15.1 |
|
| Sale of Assets/Business3 |
|
|
|
|
(19.7 |
) |
| Loss on Debt Extinguishment |
|
|
|
101.7 |
|
| Income before Income Taxes, As Adjusted |
|
|
$ |
602.2 |
|
|
|
|
|
|
|
|
| (Benefit) for Income Taxes, As Reported |
|
|
$ |
(420.4 |
) |
| Adjustments: |
|
|
|
|
|
| Valuation Allowance Releases4 |
|
|
|
540.8 |
|
| Tax Effect of Adjustments |
|
|
|
|
27.9 |
|
| Provision for Income Taxes, As Adjusted |
|
|
$ |
148.4 |
|
|
|
|
|
|
|
|
| Tax Rate, As Reported |
|
|
|
|
-89 |
% |
| Tax Rate, As Adjusted |
|
|
|
|
25 |
% |
| 1 Amounts may not sum due to rounding. |
| 2 For the year ended December 31, 2021, represents expenses related to inclined sleeper product recall litigation. |
| 3 For the year ended December 31, 2021, Mattel recorded a gain on sale of assets of $15.8 million in other selling and administrative expenses, and a gain on sale of business of $3.9 million in other non-operating expense, net. |
| 4 For the year ended December 31, 2021, the amount includes a net benefit of approximately $541 million, related to the release of valuation allowances against deferred tax assets of the U.S. and certain International affiliates. |
| MATTEL, INC. AND SUBSIDIARIES |
|
|
|
|
|
|
EXHIBIT IV |
|
|
|
|
|
|
|
|
| WORLDWIDE GROSS BILLINGS1 (Unaudited)3 |
|
|
|
|
|
|
|
| SUPPLEMENTAL KEY PERFORMANCE INDICATOR |
|
|
|
|
|
|
|
|
|
|
|
|
|
|
|
|
For the Three Months Ended March 31, |
| (In millions, except percentage information) |
2022 |
|
2021 |
|
% Change
as Reported |
|
% Change in
Constant Currency |
| Worldwide Gross Billings: |
|
|
|
|
|
|
|
| Net Sales |
$ 1,041.3 |
|
$ 874.2 |
|
19% |
|
22% |
| Sales Adjustments2 |
123.1 |
|
104.8 |
|
|
|
|
| Gross Billings |
$ 1,164.4 |
|
$ 979.0 |
|
19% |
|
23% |
|
|
|
|
|
|
|
|
| Worldwide Gross Billings by Categories: |
|
|
|
|
|
|
|
| Dolls |
$ 396.1 |
|
$ 381.3 |
|
4% |
|
8% |
| Infant, Toddler, and Preschool |
205.5 |
|
183.2 |
|
12 |
|
15 |
| Vehicles |
282.1 |
|
215.4 |
|
31 |
|
36 |
| Action Figures, Building Sets, Games, and Other |
280.7 |
|
199.2 |
|
41 |
|
44 |
| Gross Billings |
$ 1,164.4 |
|
$ 979.0 |
|
19% |
|
23% |
|
|
|
|
|
|
|
|
| Supplemental Gross Billings Disclosure |
|
|
|
|
|
|
|
|
|
|
|
|
|
|
|
| Worldwide Gross Billings by Top 3 Power Brands: |
|
|
|
|
|
|
|
| Barbie |
$ 298.0 |
|
$ 276.2 |
|
8% |
|
12% |
| Hot Wheels |
241.4 |
|
184.6 |
|
31 |
|
36 |
| Fisher-Price and Thomas & Friends |
189.3 |
|
171.6 |
|
10 |
|
13 |
| Other |
435.7 |
|
346.6 |
|
26 |
|
29 |
| Gross Billings |
$ 1,164.4 |
|
$ 979.0 |
|
19% |
|
23% |
| 1 Gross billings represent amounts invoiced to customers. It does not include the impact of sales adjustments, such as trade discounts and other allowances. Mattel presents changes in gross billings as a metric for comparing its aggregate, categorical, brand, and geographic results to highlight significant trends in Mattel’s business. |
| 2 Sales adjustments are not allocated to individual products. As such, net sales are not presented on a categories or brand level. |
| 3 Amounts may not sum due to rounding. |
| MATTEL, INC. AND SUBSIDIARIES |
|
|
|
|
|
|
|
EXHIBIT V |
|
|
|
|
|
|
|
|
|
| GROSS BILLINGS1 BY SEGMENT (Unaudited)3 |
|
|
|
|
|
|
|
|
| SUPPLEMENTAL KEY PERFORMANCE INDICATOR |
|
|
|
|
|
|
|
|
|
|
|
|
|
|
|
|
|
|
|
For the Three Months Ended March 31, |
| (In millions, except percentage information) |
|
2022 |
|
2021 |
|
% Change
as Reported |
|
% Change in
Constant Currency |
| North America Segment Gross Billings: |
|
|
|
|
|
|
|
|
| Net Sales |
|
$ 602.1 |
|
$ 479.7 |
|
26% |
|
26% |
| Sales Adjustments2 |
|
39.7 |
|
32.1 |
|
|
|
|
| Gross Billings |
|
$ 641.8 |
|
$ 511.8 |
|
25% |
|
25% |
|
|
|
|
|
|
|
|
|
| North America Gross Billings by Categories: |
|
|
|
|
|
|
|
|
| Dolls |
|
$ 182.2 |
|
$ 176.2 |
|
3% |
|
3% |
| Infant, Toddler, and Preschool |
|
131.5 |
|
108.6 |
|
21 |
|
21 |
| Vehicles |
|
146.8 |
|
109.8 |
|
34 |
|
34 |
| Action Figures, Building Sets, Games, and Other |
|
181.3 |
|
117.2 |
|
55 |
|
55 |
| Gross Billings |
|
$ 641.8 |
|
$ 511.8 |
|
25% |
|
25% |
|
|
|
|
|
|
|
|
|
| Supplemental Gross Billings Disclosure |
|
|
|
|
|
|
|
|
|
|
|
|
|
|
|
|
|
| North America Gross Billings by Top 3 Power Brands: |
|
|
|
|
|
|
|
|
| Barbie |
|
$ 164.0 |
|
$ 156.9 |
|
5% |
|
5% |
| Hot Wheels |
|
121.7 |
|
92.7 |
|
31 |
|
31 |
| Fisher-Price and Thomas & Friends |
|
121.3 |
|
100.9 |
|
20 |
|
20 |
| Other |
|
234.8 |
|
161.3 |
|
46 |
|
46 |
| Gross Billings |
|
$ 641.8 |
|
$ 511.8 |
|
25% |
|
25% |
| 1 Gross billings represent amounts invoiced to customers. It does not include the impact of sales adjustments, such as trade discounts and other allowances. Mattel presents changes in gross billings as a metric for comparing its aggregate, categorical, brand, and geographic results to highlight significant trends in Mattel’s business. |
| 2 Sales adjustments are not allocated to individual products. As such, net sales are not presented on a categories or brand level. |
| 3 Amounts may not sum due to rounding. |
| MATTEL, INC. AND SUBSIDIARIES |
|
|
|
|
|
|
|
EXHIBIT VI |
|
|
|
|
|
|
|
|
|
| GROSS BILLINGS1 BY SEGMENT (Unaudited)3 |
|
|
|
|
|
|
|
|
| SUPPLEMENTAL KEY PERFORMANCE INDICATOR |
|
|
|
|
|
|
|
|
|
|
|
|
|
|
|
|
|
|
|
For the Three Months Ended March 31, |
| (In millions, except percentage information) |
|
2022 |
|
2021 |
|
% Change
as Reported |
|
% Change in
Constant Currency |
| International Segment Gross Billings: |
|
|
|
|
|
|
|
|
| Net Sales |
|
$ 403.8 |
|
$ 349.4 |
|
16% |
|
24% |
| Sales Adjustments2 |
|
82.4 |
|
71.6 |
|
|
|
|
| Gross Billings |
|
$ 486.3 |
|
$ 420.9 |
|
16% |
|
24% |
|
|
|
|
|
|
|
|
|
| International Gross Billings by Geographic Area: |
|
|
|
|
|
|
|
|
| EMEA |
|
|
|
|
|
|
|
|
| Net Sales |
|
$ 277.7 |
|
$ 238.2 |
|
17% |
|
28% |
| Sales Adjustments2 |
|
62.6 |
|
52.9 |
|
|
|
|
| Gross Billings |
|
$ 340.4 |
|
$ 291.0 |
|
17% |
|
29% |
|
|
|
|
|
|
|
|
|
| Latin America |
|
|
|
|
|
|
|
|
| Net Sales |
|
$ 72.0 |
|
$ 56.3 |
|
28% |
|
28% |
| Sales Adjustments2 |
|
11.3 |
|
9.3 |
|
|
|
|
| Gross Billings |
|
$ 83.2 |
|
$ 65.6 |
|
27% |
|
28% |
|
|
|
|
|
|
|
|
|
| Asia Pacific |
|
|
|
|
|
|
|
|
| Net Sales |
|
$ 54.1 |
|
$ 54.9 |
|
-1% |
|
2% |
| Sales Adjustments2 |
|
8.5 |
|
9.3 |
|
|
|
|
| Gross Billings |
|
$ 62.7 |
|
$ 64.3 |
|
-2% |
|
1% |
|
|
|
|
|
|
|
|
|
| International Gross Billings by Categories: |
|
|
|
|
|
|
|
|
| Dolls |
|
$ 177.6 |
|
$ 158.7 |
|
12% |
|
21% |
| Infant, Toddler, and Preschool |
|
74.0 |
|
74.6 |
|
-1 |
|
6 |
| Vehicles |
|
135.3 |
|
105.5 |
|
28 |
|
39 |
| Action Figures, Building Sets, Games, and Other |
|
99.4 |
|
82.0 |
|
21 |
|
29 |
| Gross Billings |
|
$ 486.3 |
|
$ 420.9 |
|
16% |
|
24% |
|
|
|
|
|
|
|
|
|
| Supplemental Gross Billings Disclosure |
|
|
|
|
|
|
|
|
|
|
|
|
|
|
|
|
|
| International Gross Billings by Top 3 Power Brands: |
|
|
|
|
|
|
| Barbie |
|
$ 134.0 |
|
$ 119.3 |
|
12% |
|
22% |
| Hot Wheels |
|
119.7 |
|
91.9 |
|
30 |
|
40 |
| Fisher-Price and Thomas & Friends |
|
68.1 |
|
70.7 |
|
-4 |
|
3 |
| Other |
|
164.6 |
|
139.0 |
|
18 |
|
27 |
| Gross Billings |
|
$ 486.3 |
|
$ 420.9 |
|
16% |
|
24% |
| 1 Gross billings represent amounts invoiced to customers. It does not include the impact of sales adjustments, such as trade discounts and other allowances. Mattel presents changes in gross billings as a metric for comparing its aggregate, categorical, brand, and geographic results to highlight significant trends in Mattel’s business. |
| 2 Sales adjustments are not allocated to individual products. As such, net sales are not presented on a categories or brand level. |
| 3 Amounts may not sum due to rounding. |
| MATTEL, INC. AND SUBSIDIARIES |
|
|
|
|
|
|
EXHIBIT VII |
|
|
|
|
|
|
|
|
| GROSS BILLINGS1 BY SEGMENT (Unaudited)3 |
|
|
|
|
|
|
|
| SUPPLEMENTAL KEY PERFORMANCE INDICATOR |
|
|
|
|
|
|
|
|
|
|
|
|
|
|
|
For the Three Months Ended March 31, |
| (In millions, except percentage information) |
2022 |
|
2021 |
|
% Change
as
Reported |
|
% Change in
Constant
Currency |
| American Girl Segment Gross Billings: |
|
|
|
|
|
|
|
| Net Sales |
$ 35.3 |
|
$ 45.2 |
|
-22% |
|
-22% |
| Sales Adjustments2 |
1.0 |
|
1.1 |
|
|
|
|
| Gross Billings |
$ 36.3 |
|
$ 46.3 |
|
-22% |
|
-22% |
| 1 Gross billings represent amounts invoiced to customers. It does not include the impact of sales adjustments, such as trade discounts and other allowances. Mattel presents changes in gross billings as a metric for comparing its aggregate, categorical, brand, and geographic results to highlight significant trends in Mattel’s business. |
| 2 Sales adjustments are not allocated to individual products. |
| 3 Amounts may not sum due to rounding. |