Jakks Posts 15% Increase in Q4 Revenue on Strong Sales of Frozen 2 Products

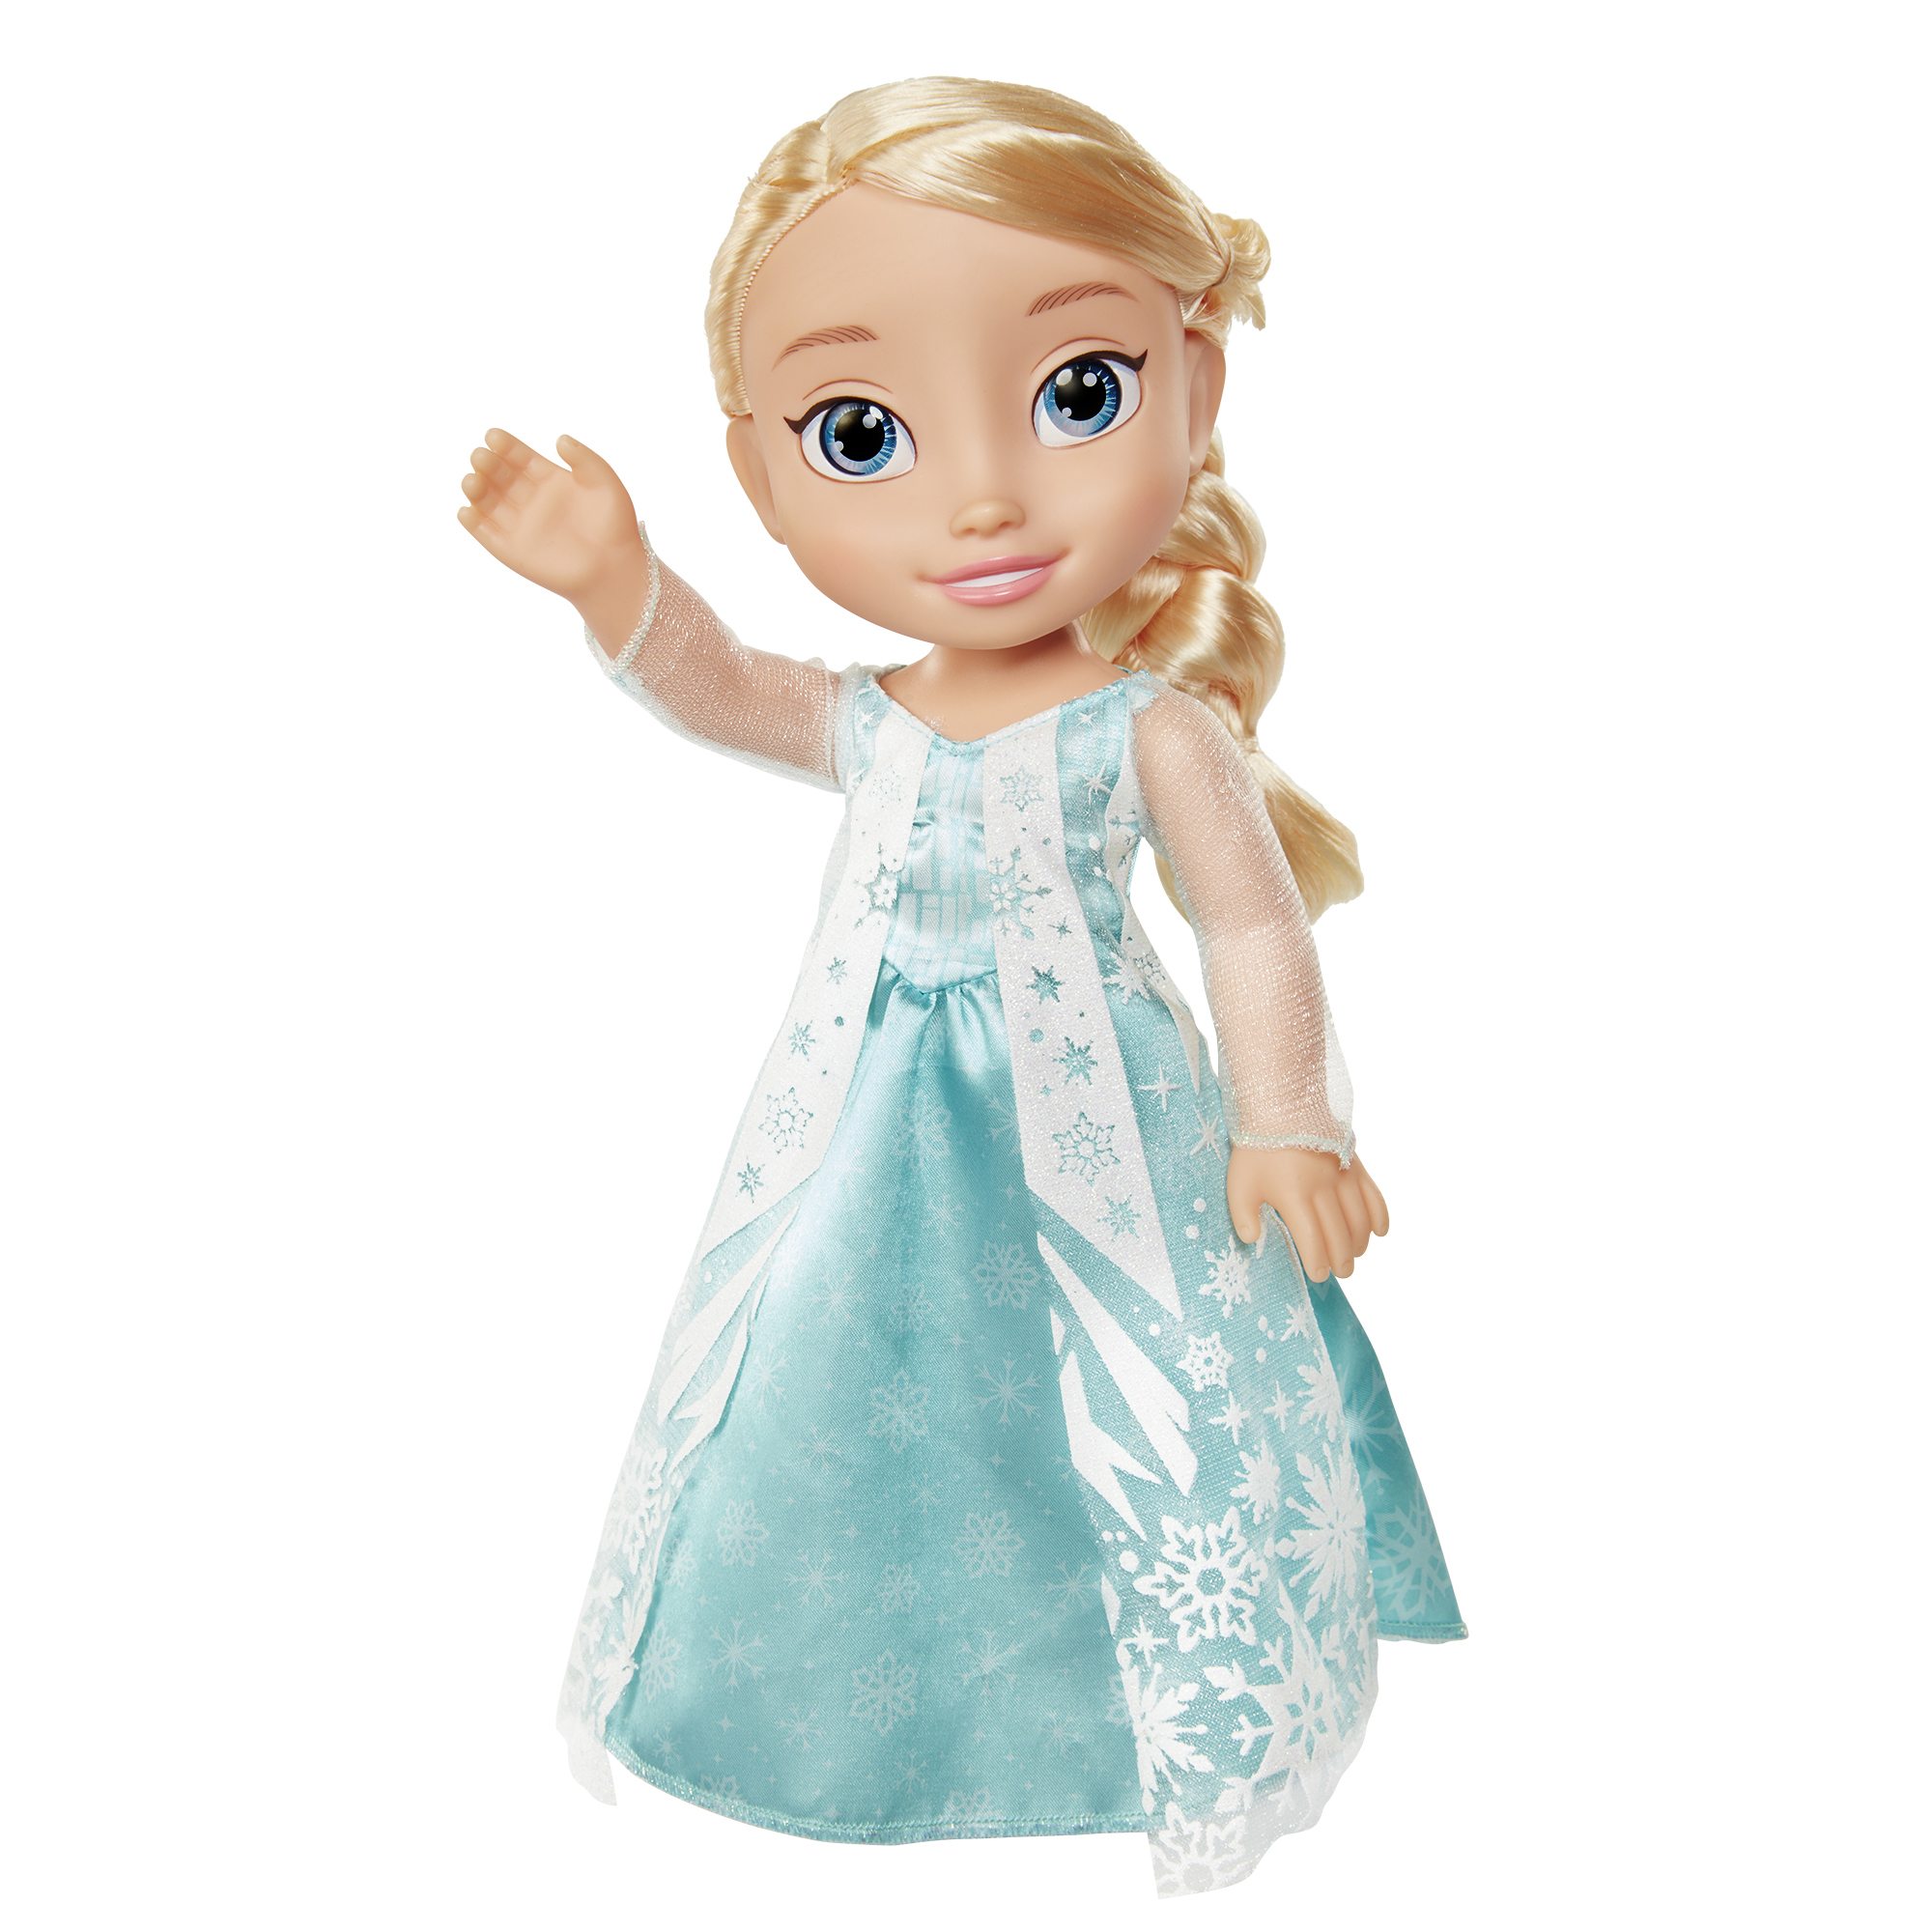
Jakks Pacific swung to a $20.6 million Q4 loss amid $10.6 million in non-cash impairment charges and despite a 15% gain in revenue to $152.5 million on the strength of strong sales of Frozen 2 products and Disguise costumes. Disney Princess, Frozen 2 and Nintendo-licensed products are expected to drive sales this year.
- Gross margin was 30.4%, compared to 30.6% in Q4 of last year.
- Net loss attributable to common stockholders was $20.6 million, or $0.70 per basic and diluted share, including non-cash charges of $10.7 million for intangibles impairment and tooling disposal, and the change in fair value of the derivative liability attributable to our preferred stock. This compares to a net loss attributable to common stockholders of $3.2 million, or $0.14 per basic and diluted share, in the fourth quarter of 2018.
- Adjusted EBITDA (a non-GAAP measure) was $3.3 million, compared to negative $1.6 million in the fourth quarter of 2018. See note below on “Use of Non-GAAP Financial Information.”
- Adjusted net loss attributable to common stockholders (a non-GAAP measure) was $0.26 per basic and diluted share, an improvement of $0.11. See note below on “Use of Non-GAAP Financial Information.”
Fiscal 2019 Overview vs. Same Period Last Year:
- Net sales were $598.6 million, up 5% compared to $567.8 million reported in the prior year, boosted by strong sales of Disney Frozen 2 products and increases in sales of Disguise costumes.
- Gross margin was 26.6%, compared to 27.4% in 2018.
- Net loss attributable to common stockholders was $56.0 million, or $2.16 per basic and diluted share, including non-cash charges totaling $23.9 million for intangibles impairment and tooling disposal, the change in fair value of the derivative liability attributable to our preferred stock, and the loss on the extinguishment of debt resulting from our recapitalization transaction in Q3 of 2019. This compares to a net loss attributable to common stockholders of $42.4 million, or $1.83 per basic and diluted share in 2018.
- Adjusted EBITDA (a non-GAAP measure) was $18.9 million, a significant improvement compared to $2.3 million in 2018. See note below on “Use of Non-GAAP Financial Information.”
- Adjusted net loss attributable to common stockholders (a non-GAAP measure) was $0.73 per basic and diluted share, an improvement of $0.52. See note below on “Use of Non-GAAP Financial Information.”
Management Commentary
JAKKS Chairman and CEO Stephen Berman stated, “We are pleased to report solid improvement in our sales and adjusted EBITDA for the fourth quarter and for the full-year of 2019. Despite significant industry-wide softness in retail toy sales through most of 2019, including the holiday season, we were able to grow our sales, as strong sales of Disney Frozen 2, Disguise® and Nintendo® more than offset the declines of some older products. Our net sales grew 15% in the quarter, continuing the momentum we saw in the third quarter. For the full year, our sales were up 5%, led by the strong performance of several product lines. More importantly, we were able to meaningfully reduce our normal operating expenses, resulting in a significant improvement in adjusted EBITDA for the year.
“We closed out the year on a strong note and have carried momentum into 2020. We remain committed to containing costs and managing our balance sheet prudently. We expect good performance in 2020 driven by expansion within our evergreen categories and new product initiatives, coupled with new licenses as well as current licenses that we see growing in popularity, and additional owned IP launching throughout the year. We expect licenses such as Disney Princess, Frozen 2, Nintendo and others to benefit our 2020 results.”
Cash and Cash Equivalents
The Company’s cash and cash equivalents (including restricted cash) totaled $66.3 million as of December 31, 2019 compared to $58.2 million as of December 31, 2018.
Use of Non-GAAP Financial Information
In addition to the preliminary results reported in accordance with U.S. GAAP included in this release, the Company has provided certain non-GAAP financial information including Adjusted EBITDA which is a non-GAAP metric that excludes various items that are detailed in the financial tables and accompanying footnotes reconciling GAAP to non-GAAP results contained in this release. Management believes that the presentation of these non-GAAP financial measures provides useful information to investors because the information may allow investors to better evaluate ongoing business performance and certain components of the Company’s results. In addition, the Company believes that the presentation of these financial measures enhances an investor’s ability to make period-to-period comparisons of the Company’s operating results. This information should be considered in addition to the results presented in accordance with GAAP, and should not be considered a substitute for the GAAP results. The Company has reconciled the non-GAAP financial information included in this release to the nearest GAAP measures. See the attached “Reconciliation of Non-GAAP Financial Information.”
Conference Call Live Webcast
JAKKS Pacific will webcast its fourth quarter earnings call at 9:00 a.m. Eastern Time/6:00 a.m. Pacific Time today. To listen to the live webcast and access the accompanying presentation slides, go to www.jakks.com/investors and click on the earnings website link under the Presentations tab at least 10 minutes prior to register, download and install any necessary audio software.
A replay of the call will be available on JAKKS’ website approximately one hour following completion of the call through February 26, 2020 ending at 11:59 p.m. Eastern Time/8:59 p.m. Pacific Time. The playback can be accessed by calling (888) 843-7419 or (630) 652-3042 for international callers, with passcode “49386015#” for both playback numbers.
About JAKKS Pacific, Inc.
JAKKS Pacific, Inc. (NASDAQ: JAKK) is a leading designer, manufacturer and marketer of toys and consumer products sold throughout the world, with its headquarters in Santa Monica, California. JAKKS Pacific’s popular proprietary brands include Perfectly Cute™, Real Workin’ Buddies™, XPV®, Disguise®, Moose Mountain®, Maui®, Kids Only!®; a wide range of entertainment-inspired products featuring premier licensed properties; and C’est Moi™, a new generation of clean beauty. Through JAKKS Cares, the company’s commitment to philanthropy, JAKKS is helping to make a positive impact on the lives of children. Visit us at www.jakks.com and follow us on Instagram (@jakkstoys), Twitter (@jakkstoys) and Facebook (JAKKS Pacific).
©2020 JAKKS Pacific, Inc. All rights reserved.
Forward Looking Statements
This press release may contain “forward-looking statements” (within the meaning of the Private Securities Litigation Reform Act of 1995) that are based on current expectations, estimates and projections about JAKKS Pacific’s business based partly on assumptions made by its management. These statements are not guarantees of future performance and involve risks, uncertainties and assumptions that are difficult to predict. Therefore, actual outcomes and results may differ materially from what is expressed or forecasted in such statements due to numerous factors, including, but not limited to, those described above, changes in demand for JAKKS Pacific’s products, product mix, the timing of customer orders and deliveries, the impact of competitive products and pricing, or that the Recapitalization transaction or any future transactions will result in future growth or success of JAKKS. The “forward-looking statements” contained herein speak only as of the date on which they are made, and JAKKS undertakes no obligation to update any of them to reflect events or circumstances after the date of this release.
| JAKKS Pacific, Inc. and Subsidiaries | ||||||
| Consolidated Balance Sheets (Unaudited) | ||||||
| December 31, | December 31, | |||||
| 2019 | 2018 | |||||
| (In thousands) | ||||||
| ASSETS | ||||||
| Current assets: | ||||||
| Cash and cash equivalents | $ 61,613 | $ 53,282 | ||||
| Restricted cash | 4,673 | 4,923 | ||||
| Accounts receivable, net | 117,942 | 122,278 | ||||
| Inventory | 54,259 | 53,880 | ||||
| Prepaid expenses and other assets | 21,898 | 15,780 | ||||
| Total current assets | 260,385 | 250,143 | ||||
| Property and equipment | 121,821 | 128,049 | ||||
| Less accumulated depreciation and amortization | 106,562 | 107,147 | ||||
| Property and equipment, net | 15,259 | 20,902 | ||||
| Operating lease right-of-use assets | 32,081 | – | ||||
| Goodwill | 35,083 | 35,083 | ||||
| Intangibles and other assets, net | 22,414 | 36,713 | ||||
| Total assets | $ 365,222 | $ 342,841 | ||||
| LIABILITIES, PREFERRED STOCK AND STOCKHOLDERS’ EQUITY | ||||||
| Current liabilities: | ||||||
| Accounts payable and accrued expenses | $ 100,711 | $ 87,488 | ||||
| Reserve for sales returns and allowances | 38,365 | 29,403 | ||||
| Income taxes payable | 2,492 | – | ||||
| Short term operating lease liabilities | 9,451 | – | ||||
| Short term debt, net | 1,905 | 27,211 | ||||
| Total current liabilities | 152,924 | 144,102 | ||||
| Long term operating lease liabilities | 25,632 | – | ||||
| Long term debt, net | 174,962 | 139,792 | ||||
| Other liabilities | 5,409 | 4,409 | ||||
| Income taxes payable | 1,565 | 1,458 | ||||
| Deferred income taxes, net | 226 | 1,431 | ||||
| Total liabilities | 360,718 | 291,192 | ||||
| Preferred stock | 483 | – | ||||
| Stockholders’ equity: | ||||||
| Common stock, $.001 par value | 36 | 30 | ||||
| Additional paid-in capital | 200,475 | 218,155 | ||||
| Treasury stock | – | (24,000) | ||||
| Accumulated deficit | (183,149) | (127,601) | ||||
| Accumulated other comprehensive loss | (14,422) | (15,847) | ||||
| Total JAKKS Pacific, Inc. stockholders’ equity | 2,940 | 50,737 | ||||
| Non-controlling interests | 1,081 | 912 | ||||
| Total stockholders’ equity | 4,021 | 51,649 | ||||
| Total liabilities, preferred stock and stockholders’ equity | $ 365,222 | $ 342,841 | ||||
| JAKKS Pacific, Inc. and Subsidiaries | |||||||||
| Consolidated Statements of Operations (Unaudited) | |||||||||
| Three Months Ended December 31, | Year Ended December 31, | ||||||||
| 2019 | 2018 | 2019 | 2018 | ||||||
| (In thousands, except per share data) | (In thousands, except per share data) | ||||||||
| Net sales | $ 152,511 | $ 132,326 | $ 598,649 | $ 567,810 | |||||
| Less cost of sales | |||||||||
| Cost of goods | 80,916 | 71,356 | 335,450 | 319,788 | |||||
| Royalty expense | 22,657 | 19,040 | 91,775 | 81,794 | |||||
| Amortization of tools and molds * | 2,538 | 1,444 | 12,079 | 10,512 | |||||
| Cost of sales | 106,111 | 91,840 | 439,304 | 412,094 | |||||
| Gross profit | 46,400 | 40,486 | 159,345 | 155,716 | |||||
| Direct selling expenses | 20,767 | 16,565 | 55,103 | 54,851 | |||||
| Selling, general and administrative expenses | 25,124 | 24,382 | 99,580 | 123,722 | |||||
| Depreciation and amortization | 1,597 | 1,646 | 6,527 | 6,569 | |||||
| Intangibles impairment | 9,379 | – | 9,379 | – | |||||
| Restructuring charge | 47 | 1,114 | 341 | 1,114 | |||||
| Acquisition related and other | 247 | 1,197 | 6,204 | 1,633 | |||||
| Loss from operations | (10,761) | (4,418) | (17,789) | (32,173) | |||||
| Other income (expense): | |||||||||
| Income from joint ventures | – | – | – | 227 | |||||
| Other income (expense), net | (1,035) | (152) | (1,158) | 152 | |||||
| Loss on extinguishment of debt | – | – | (13,205) | (453) | |||||
| Change in fair value of convertible senior notes | (2,120) | 5,462 | (5,112) | 2,948 | |||||
| Change in fair value of derivative liability | (353) | – | (353) | – | |||||
| Interest income | 21 | 21 | 85 | 68 | |||||
| Interest expense | (5,381) | (3,013) | (15,935) | (10,243) | |||||
| Loss before provision for income taxes | (19,629) | (2,100) | (53,467) | (39,474) | |||||
| Provision for income taxes | 552 | 1,243 | 1,912 | 2,951 | |||||
| Net loss | (20,181) | (3,343) | (55,379) | (42,425) | |||||
| Net income (loss) attributable to non-controlling interests | 112 | (96) | 169 | (57) | |||||
| Net loss attributable to JAKKS Pacific, Inc. | $ (20,293) | $ (3,247) | $ (55,548) | $ (42,368) | |||||
| Net loss attributable to common stockholders | $ (20,596) | $ (3,247) | $ (56,031) | $ (42,368) | |||||
| Loss per share – basic and diluted | $ (0.70) | $ (0.14) | $ (2.16) | $ (1.83) | |||||
| Shares used in loss per share – basic and diluted | 29,617 | 23,106 | 25,980 | 23,104 | |||||
| * Includes $972 of tools and molds disposal | |||||||||
JAKKS Pacific, Inc. and Subsidiaries
Reconciliation of Non-GAAP Financial Information (Unaudited)
Reconciliation of GAAP to Non-GAAP measures:
This press release and accompanying schedules provide certain information regarding Adjusted EBITDA and Adjusted Net Income (Loss), which may be considered non-GAAP financial measures under the rules of the Securities and Exchange Commission. The non-GAAP financial measures included in the press release are reconciled to the corresponding GAAP financial measures below, as required under the rules of the Securities and Exchange Commission regarding the use of non-GAAP financial measures. We define Adjusted EBITDA as income (loss) from operations before depreciation, amortization and adjusted for certain non-recurring and non-cash charges, such as reorganization expenses and restricted stock compensation expense. Net income (loss) is similarly adjusted and tax-effected to arrive at Adjusted Net Income (Loss). Adjusted EBITDA and Adjusted Net Income (Loss) are not recognized financial measures under GAAP, but we believe that they are useful in measuring our operating performance. We believe that the use of the non-GAAP financial measures enhances an overall understanding of the Company’s past financial performance, and provides useful information to the investor by comparing our performance across reporting periods on a consistent basis.
Investors should not consider these measures in isolation or as a substitute for net income, operating income, or any other measure for determining the Company’s operating performance that is calculated in accordance with GAAP. In addition, because these measures are not calculated in accordance with GAAP, they may not necessarily be comparable to similarly titled measures employed by other companies.
| Three Months Ended December 31, | Year Ended December 31, | ||||||||
| 2019 | 2018 | 2019 | 2018 | ||||||
| (In thousands) | (In thousands) | ||||||||
| Net loss | $ (20,181) | $ (3,343) | $ (55,379) | $ (42,425) | |||||
| Income from joint ventures | – | – | – | (227) | |||||
| Other (income) expense, net | (165) | 152 | (42) | (152) | |||||
| Loss on extinguishment of debt | – | – | 13,205 | 453 | |||||
| Interest income | (21) | (21) | (85) | (68) | |||||
| Interest expense | 5,381 | 3,013 | 15,935 | 10,243 | |||||
| Provision for income taxes | 552 | 1,243 | 1,912 | 2,951 | |||||
| Depreciation and amortization | 4,135 | 3,090 | 18,606 | 17,081 | |||||
| Acquisition related and other | 247 | 1,197 | 6,204 | 1,633 | |||||
| Restricted stock compensation expense | 996 | 687 | 2,868 | 2,434 | |||||
| Bad debt write-offs (recoveries) | (713) | (3,242) | (713) | 8,722 | |||||
| Intangibles impairment | 9,379 | – | 9,379 | – | |||||
| Change in fair value of convertible senior notes | 2,120 | (5,462) | 5,112 | (2,948) | |||||
| Change in fair value of derivative liability | 353 | – | 353 | – | |||||
| Unclaimed property liability (1999-2014) | 1,200 | – | 1,200 | – | |||||
| Restructuring charge | 47 | 1,114 | 341 | 1,114 | |||||
| Minimum guarantee shortfalls | – | – | – | 3,468 | |||||
| Adjusted EBITDA | $ 3,330 | $ (1,572) | $ 18,896 | $ 2,279 | |||||
| Three Months Ended December 31, | Year Ended December 31, | ||||||||
| 2019 | 2018 | 2019 | 2018 | ||||||
| (In thousands, except per share data) | (In thousands, except per share data) | ||||||||
| Net loss attributable to common stockholders | $ (20,596) | $ (3,247) | $ (56,031) | $ (42,368) | |||||
| Restricted stock compensation expense | 996 | 687 | 2,868 | 2,434 | |||||
| Loss on extinguishment of debt | – | – | 13,205 | 453 | |||||
| Bad debt write-offs (recoveries) | (713) | (3,242) | (713) | 8,722 | |||||
| Acquisition related and other | 247 | 1,197 | 6,204 | 1,633 | |||||
| Change in fair value of convertible senior notes | 2,120 | (5,462) | 5,112 | (2,948) | |||||
| Change in fair value of derivative liability | 353 | – | 353 | – | |||||
| Intangibles impairment | 9,379 | – | 9,379 | – | |||||
| Restructuring charge | 47 | 1,114 | 341 | 1,114 | |||||
| Unclaimed property liability (1999-2014) | 1,200 | – | 1,200 | – | |||||
| Minimum guarantee shortfalls | – | – | – | 3,468 | |||||
| Tax impact of additional charges | (786) | 304 | (816) | (1,439) | |||||
| Adjusted net loss attributable to common stockholders | $ (7,753) | $ (8,649) | $ (18,898) | $ (28,931) | |||||
| Adjusted loss per share – basic and diluted | $ (0.26) | $ (0.37) | $ (0.73) | $ (1.25) | |||||
| Shares used in adjusted loss per share – basic and diluted | 29,617 | 23,106 | 25,980 | 23,104 | |||||
View source version on businesswire.com: https://www.businesswire.com/news/home/20200219005299/en/
Source: JAKKS Pacific, Inc.
JAKKS Pacific
Jared Wolfson
SVP Marketing and Entertainment
(424) 268-9330
jwolfson@jakks.net
Gateway Investor Relations
Sean McGowan
Managing Director
(949) 574-3860
smcgowan@gatewayir.com